

On the daily chart, the pair has remained in the range since mid-September (0.7230-0.7300). A pullback from 0.7300 after the formation of a candle close to the "hammer" may be a bearish signal, since the bullish one has not been confirmed, but the pair remains above the key support zone of 0.7200-0.7230, and in general, the neutralization of the downward trend continues. An exit from the 0.7230-0.7300 range upwards still seems more likely, given the false breakout earlier and the strength of the support level.
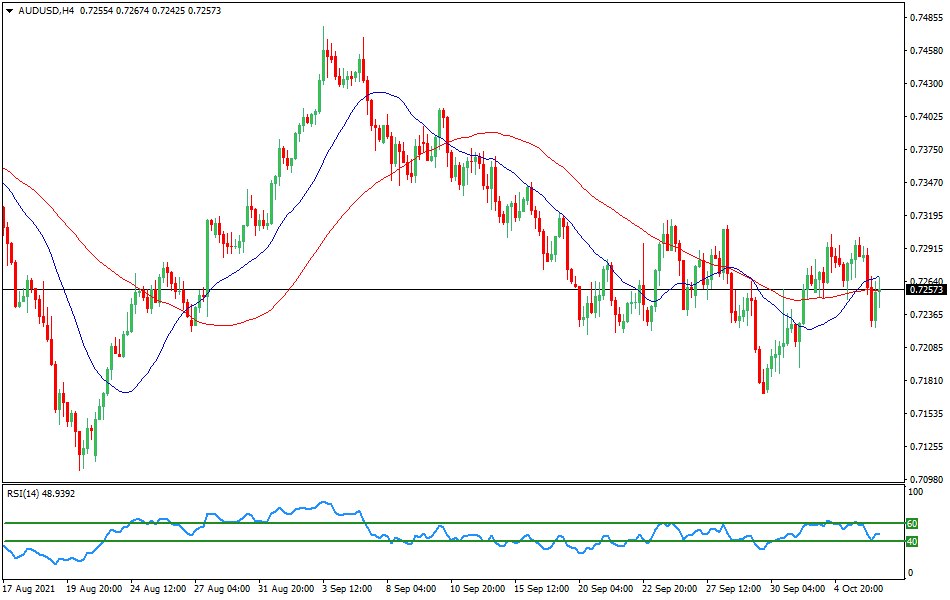
On the four-hour chart, the pair remained in the range of 0.7230-0.7300, receiving support at the lower border. While the pair is above 0.7230, the risk of a rebound back to 0.7300 is high. In the broader perspective, the pair remains in a prolonged flat: the movement in a rather narrow range has been maintained since October 20, and the movement after leaving the range may be strong. According to directional movement indicators, there is no pronounced trend: ADX is at a low level, DM+ and DM- intersect, shorter-term indicators indicate a decline: the MACD histogram is declining in the negative zone, the MACD line has received a negative slope.
Resistance levels: 0.7270; 0.7300
Support levels: 0.7230; 0.7200

 With the opening of trading in Asia on Monday, this currency pair is trading with a decrease in quotations, remaining within the current support level at 1.3185 and the resistance level at 1.3291, where the market chart progresses below exponential moving averages with a period of 21 and 55 days, demonstrating the advantage of sellers in this market in the short term.On the four-hour chart, the moving averages slowed down, reducing the divergence and formed a sell signal, which indicates the appearance of a bearish trend in this market in the short and medium term.The technical picture also shows a slightly stronger sellers' positions, as the MACD histogram entered the area below its central line, and the strength indicator of the current RSI movement dropped to the 40 line, confirming the advantage of bears in this market in the short term.Thus, we intend to sell this trading instrument today.GBP/USD
  At trading in Asia on Monday, this currency pair is trading with a slight decrease in quotations, remaining within the current support level at 0.9196 and at the resistance level around 0.9277.On the four-hour chart, the moving averages with a period of 21 and 55 continue to develop in a narrow range, maintaining a slight discrepancy, which demonstrates the lack of advantage of any of the parties in this market. The four-hour quotation chart continues to develop in the area slightly above exponential moving averages, confirming the small upward potential of this market in the short term.The technical picture shows a slight advantage of the bulls, as the MACD histogram remains in the area just above its central line, and the strength indicator of the current RSI movement has risen just above the 50 line, which confirms a small bullish potential in the short term.Thus, we intend to buy this trading instrument today.USD/CHF
  There was a sharp reversal on the daily chart, as a result, the pair returned below the level of 1.28500 and, thus, below the high of late November - early December. A reversal candle combination with a "shooting star" was formed. In the longer term, assuming the preservation of this year's range, the pair may decline to 1.24-1.2450, and in the shorter term - to the low of the beginning of December above 1.2600. The decline from 1.2950 can be considered as a correction, the determining factor here will probably be the preservation of the pair below the key resistance at 1.2850. While the pair is lower, a resumption of the decline seems more likely.There was a reversal on the four-hour chart after a sharp decline from 1.2950. At the same time, absorption was formed, and the very formation of a relatively wide-range candle shows that the direction of least resistance was a decrease. The current upward rebound can be considered as a correction to a decline. In favor of this view is that it remains small in size and much slower than the wave of decline before it.Resistance levels: 1.2850; 1.2950Support levels: 1.2800; 1.2700USD/CAD
  On the daily chart, an important change is the overcoming of the downward trend line at the end of October, which coincided with the overcoming of the resistance level of 151.00. After overcoming the trend line, the pair almost reached resistance at 152.70. The formation of a "shooting star" there may lead to a return to the trend line (with a decline on Friday, the "shooting star" signal will be confirmed, and the pair would also overcome support at the upper limit of consolidation in early December). If the trend line is corrected, then the pair has already returned below it, in this case, the formation of a "shooting star" looks like a trend puncture. In this case, when closing below 151.00, the pair may return to support at 149.25. Further movement will probably depend on whether the level of 151.00 is overcome.On the four-hour chart, the price went up from the range of 149.25-151.00, but now it is returning to it. If the pair stays below 151.00, it would be a bearish signal in the short term, as the pair would decline below the trend line and return to the channel it was in for most of December. And as part of the movement in the channel, a decrease would be preferable. A recovery of the pair above the trend line would make growth more likely in the short term.Resistance levels 151.00; 152.00Support Level: 149.25GBP/JPY
  On the daily chart, the pair recovered after a pullback from 0.7200, but this level was not overcome. The pair remains between the "round" levels of 0.7100 and 0.7200. If we consider the puncture of the 0.7200 level as a false breakdown, then within the movement in the range, a decrease to the lower limit by 0.7100 is more likely. In a broader perspective, growth seems preferable, since the direction has changed after overcoming the trend line. The relative highs and lows of the pair are now rising. According to directional movement indicators, the trend is changing: there is no longer an excess of DM- over DM+, the MACD histogram is growing in a positive zone, the MACD line has a positive slope.On the four-hour chart, the pair returned below the "round" level of 0.7200, which looks like a false breakdown of the upper limit of the 0.7100-0.7200 range. If we assume movement in the range, the goal seems to be a decrease to the lower limit. According to the indicators of directional movement of the flat: DM+ and DM- are close, the MACD histogram fluctuates near the zero level, the MACD line also changes direction. In the conditions of a range without a significant catalyst (which even the Fed meeting did not become), it is not expected to exit.Resistance levels: 0.7200; 0.7265Support levels: 0.7100; 0.7000AUD/USD
  On the daily chart, the pair has moved up from the range of 127.50-128.70, and the upper limit now acts as a support level. Despite the formation of a large "shooting star" on Thursday, there has been no confirmation yet. If the pair holds above 128.70, it may even be a bullish signal - since the bearish one would not receive confirmation. By itself, the exit from the range up is also a bullish signal, as well as the pair reaching a new higher maximum. According to the directional movement indicators, growth is becoming a trend: DM+ is now higher than DM-, the MACD histogram is already growing in the positive zone.On the four-hour chart, after a sharp decline from 129.60, the pair received support at the previously overcome upper limit of the 128.70 range. Since the beginning of December, the lows of the pair have been rising, and so far, continued growth remains preferable. Also, the pair is above the trend line, if you build it at the lows in December. If the pullback continues, the pair may receive support on the trend line.Resistance level: 129.00; 129.60Support levels: 128.70; 128.00EUR/JPY
  At trading in Asia on Thursday, the EUR/USD currency pair is trading with an increase in quotations, remaining within the current support level at 1.1248 and at the resistance level at 1.1350. The four-hour chart continues to develop in the area above exponential moving averages, demonstrating the bullish potential of this market in the short term.Moving averages with a period of 21 and 55 days are turning up and have formed a buy signal, which opens up the possibility for an uptrend to appear in this market in the short term.The technical picture also indicates the advantage of bulls in this market, since the MACD histogram has entered the area above its central line, and the strength indicator of the current RSI movement has risen above the 60 line, confirming the upward potential of this market in the short term.Thus, we intend to buy this trading instrument today.EUR/USD
  With the opening of trading in Asia on Thursday, this currency pair is trading with an increase in quotations, remaining within the current support level at 1.3222 and the resistance level at 1.3389, where the market chart continues to progress above exponential moving averages with a period of 21 and 55 days, demonstrating the advantage of buyers in this market in the short term.On the four-hour chart, the moving averages have slowed down, reducing the divergence and are ready to turn up, which indicates the appearance of a bullish trend in this market in the short and medium term.The technical picture also demonstrates a slightly stronger position of buyers, as the MACD histogram entered the area above its central line, and the strength indicator of the current RSI movement rose above the 60 line, confirming the advantage of bulls in this market in the short term.Thus, we intend to buy this trading instrument today.GBP/USD