
Guide to Using Technical Analysis in Trading
Education
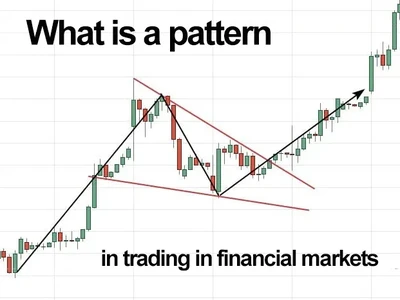
What is a pattern in trading in financial markets
Geometry in financial marketsTechnical analysis is a serious method of forecasting the movement of asset prices on the stock exchange. Its adherents believe that all the events, news,...
Oct 07, 2023
Read
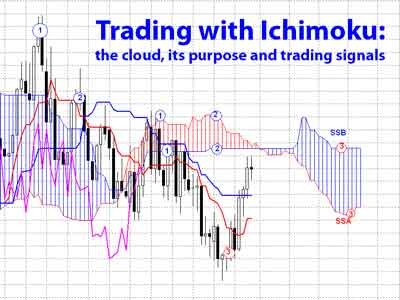
Trading with Ichimoku: the cloud, its purpose and trading signals
If you already have basic knowledge of how to work in financial markets and are on the verge of building your own trading system, I recommend studying the Ichimoku indicator. The Ichimoku...
Nov 09, 2022
Read
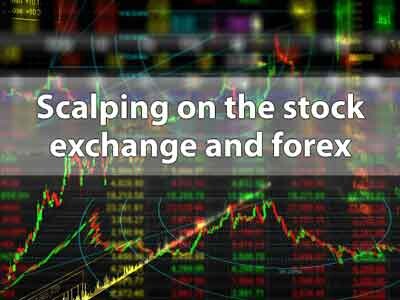
Scalping on the stock exchange and forex
Scalping is one of the trading strategies for intraday trading on the stock market and forex. Trading itself is a rather risky activity, and if we are talking about such methods of...
Jul 14, 2022
Read
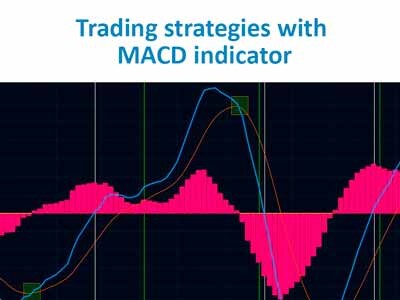
Trading strategies with the MACD indicator
If you are looking for profitable trading strategies, you have probably already read a ton of materials on this topic. Some of the things published on the Internet really work, but...
Apr 17, 2022
Read

AUDUSD: analysis, signals, forecast for today and quotes
AUD/USD ("Aussie") is a currency pair popular among traders, consisting of the Australian and American dollars.The base currency in this combination is AUD, that is, when buying a pair,...
Mar 22, 2022
Read
Types of analysis on the forex and stock market with its types and full description
Every day, the foreign exchange market, and the stock exchange as a whole, attract more and more people. From the very moment of the appearance of trading in currency pairs in the form...
Jan 13, 2022
Read
Graphical analysis on forex, stock and cryptocurrency markets
Graphical analysis of the market is a subsection of technical analysis in which the investigated element is the chart itself.It is quite easy to learn, while almost all activities are...
Jan 09, 2022
Read
Wave Analysis in Forex
Wave analysis is a section of technical analysis based on the theory of market movement according to certain rules outlined by Elliott in the middle of the last century.At first glance,...
Jan 09, 2022
Read

Candlestick analysis on Forex
Candlestick analysis can be called the main type of graphical analysis, in which the object of study is a Japanese candle - a structural unit of a candle chartThe candles themselves...
Jan 09, 2022
Read
The basis of trading: Support and Resistance levels
If you look at the chart of any time frame, you can notice an interesting pattern - almost always price reversals do not occur in random places, but where there was once something similarAs...
Jan 08, 2022
Read
.jpg)
How to start trading forex from scratch
Forex for beginners or forex how to start from scratch seems like something incredible and difficult. these charts, a lot of tools to help - the eyes run away from all this and traders...
Nov 01, 2021
Read
What is Technical Analysis and why does an investor need it
Stock charts do not just show prices. With their help, some analysts and investors make trading decisions. We talk about how this can work.This material is for informational purposes...
Aug 17, 2021
Read

Using the MACD indicator in forex trading
The moving average convergence/divergence indicator (MACD) is one of the best solutions to use when working in the financial markets. Learning how to implement the tool is crucial to...
May 01, 2021
Read

Profit by DMI and ADX
Directional Movement Indicator (DMI)Average Directional Movement Index (ADX)The vast majority of profitable trading systems involve some form of trend following, however most of the...
Apr 09, 2021
Read

About CCI - Commodity Channel Index
Commodity Channel Index (CCI - Commodity Channel Index)The Commodity Channel Index was first described by Donald Lambert in the October 1980 issue of Commodities (now Futures)...
Apr 08, 2021
Read

On the world's financial markets and stock exchanges. Part 9
1. Fibonacci sequence1.1 History of the discoveryIn the 13th century, Thomas Aquinas formulated one of the basic principles of aesthetics - that objects with correct proportions are...
Apr 07, 2021
Read

On the world's financial markets and stock exchanges. Part 8
1. IntroductionTo become a modern trader who uses a computer in his trading, you need to do three steps: choose the software, the computer and the data for analysis.If you want to work...
Apr 06, 2021
Read

On the world's financial markets and stock exchanges. Part 5
1. Dow Theory1.1 History of technical analysis. The beginnings of technical analysis were preceded by observations of price changes in financial markets over the centuries. The...
Apr 05, 2021
Read

On the world's financial markets and stock exchanges. Part 3
"...Players are rewarded for buying what no one wants when no one wants it, and selling what everyone wants and when everyone needs it."Bill Williams1) Technical analysis1.1 The concept...
Apr 04, 2021
Read