

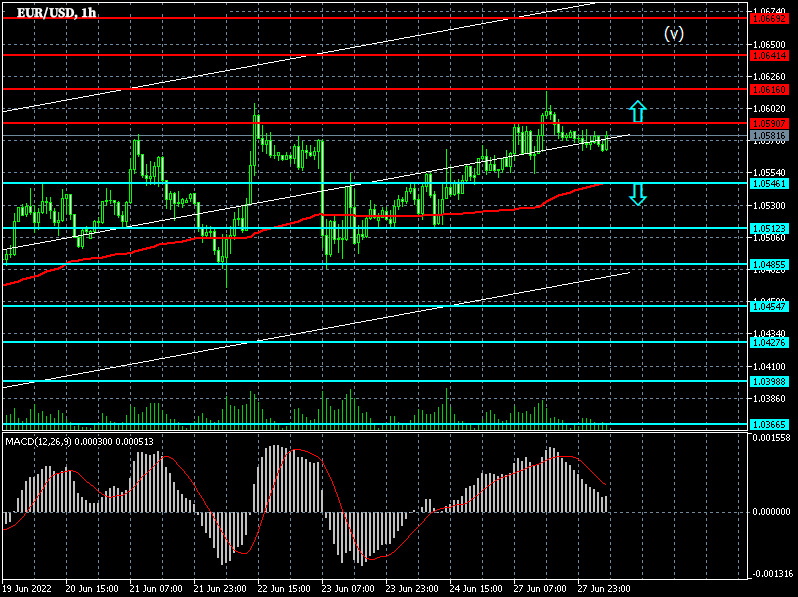
The euro/dollar pair is traded on an hourly chart within the framework of an uptrend. It shows that the euro/dollar exchange rate is trading above the level of the moving average with a period of 55 on the hourly chart (level 1.0546), which disposes to a price increase in the short term. I recommend working from purchases within the framework of this wave model.
The signal to open a long position will be a breakdown at the end of the resistance hour at 1.0591 in order to increase to the resistance at 1.0616 and in case of its breakdown at the end of the hour to 1.0641. The stop loss with this strategy can be placed at the level of 1.0535.
The signal to open a short position will be a breakdown at the end of the support hour at the level of 1.0546 in order to reduce to support at the level of 1.0512 and in case of its breakdown at the end of the hour to 1.0485. The stop loss with this strategy can be placed at the level of 1.0595.
Given that the moving average and the location of the boundaries of technical figures are moving over time, it is necessary to adjust their position on the hourly chart. I also recommend opening positions at the end of the hour to avoid false breakouts.

 Express forex forecast for the GBP/USD pairBased on technical modeling for the pound/dollar pair, a forecast of further movement has been formed and the average price is predisposed to decline.In this technical situation, the pound can be sold from the level of 1.2614, you can also place a pending sell order at the level of 1.2679 in order to decrease to the area of 1.2525-1.2445, the stop with this strategy can be placed at the level of 1.2725.If we receive a profit of 30 points or more, we fix 50% of the position, and put the rest at breakeven. If this forecast for the GBP/USD pair coincides with your opinion, then you can safely use this strategy.Forex strategy for the USD/CAD pairThe USD/CAD pair is trading within an uptrend on a 4-hour chart. It shows that the USD/CAD exchange rate is trading above the moving average with a period of 55 on the hourly chart (level 1.3549), which generally contributes to the price increase in the short term. I recommend working on this pair from sales based on the established wave model.The signal to open a long position will be a breakdown at the end of the resistance hour at the level of 1.3629 in order to increase to the resistance at the level of 1.3678 and in case of its breakdown at the end of the hour to 1.3736. The stop loss with this strategy can be placed at the level of 1.3540.The signal to open a short position will be a breakdown at the end of the support hour at 1.3549 with the aim of reducing to support at 1.3488 in case of its breakdown at the end of the 1.3429 hour. The stop loss with this strategy can be placed at the level of 1.3653.Given that the moving average and the location of the boundaries of technical figures are moving over time, it is necessary to adjust their position on the hourly chart. I also recommend opening positions at the end of the hour to avoid false breakouts.
  Express forex forecast for the GBP/USD pairBased on technical modeling for the pound/dollar pair, a forecast of further movement has been formed and the average is urgently predisposed to an increase.In this technical situation, the pound can be bought from the level of 1.2591, you can also place a pending purchase order at the level of 1.2551 in order to increase to the area of 1.2733-1.2984, the stop with this strategy can be placed at the level of 1.2530.If we receive a profit of 30 points or more, we fix 50% of the position, and put the rest at breakeven. If this forecast for the GBP/USD pair coincides with your opinion, then you can safely use this strategy.Forex strategy for the USD/CAD pairThe USD/CAD pair is trading within an uptrend on a 4-hour chart. It shows that the USD/CAD exchange rate is trading above the moving average with a period of 55 on the hourly chart (level 1.3547), which generally contributes to the price increase in the short term. I recommend working on this pair from sales based on the established wave model.The signal to open a long position will be a breakdown at the end of the resistance hour at 1.3627 in order to increase to the resistance at 1.3678 and in case of its breakdown at the end of the hour to 1.3719. Stop loss with this strategy can be placed at 1.3560.The signal to open a short position will be a breakdown at the end of the support hour at the level of 1.3488 with the aim of reducing to support at the level of 1.3429 in case of its breakdown at the end of the hour 1.3381. The stop loss with this strategy can be placed at the level of 1.3615.Given that the moving average and the location of the boundaries of technical figures are moving over time, it is necessary to adjust their position on the hourly chart. I also recommend opening positions at the end of the hour to avoid false breakouts.
  Forex forecast for USD/CADThe USD/CAD pair is trading within an uptrend on a 4-hour chart. It shows that the USD/CAD exchange rate is trading above the moving average with a period of 55 on the hourly chart (level 1.3509), which generally contributes to the price increase in the short term. I recommend working on this pair from sales based on the established wave model.The signal to open a long position will be a breakdown at the end of the resistance hour at 1.3575 in order to increase to the resistance at 1.3627 and in case of its breakdown at the end of the hour to 1.3678. Stop loss with this strategy can be placed at 1.3480.The signal to open a short position will be a breakdown at the end of the support hour at 1.3488 with the aim of reducing to support at 1.3429 in case of its breakdown at the end of the 1.3381 hour. The stop loss with this strategy can be placed at the level of 1.3615.Given that the moving average and the location of the boundaries of technical figures are moving over time, it is necessary to adjust their position on the hourly chart. I also recommend opening positions at the end of the hour to avoid false breakouts.Forex forecast for GBP/USDBased on technical modeling for the pound/dollar pair, a forecast of further movement has been formed and the average price is predisposed to decline.In this technical situation, the pound can be sold from the level of 1.2725, you can also place a pending sell order at the level of 1.2767 in order to decrease to the area of 1.2609-1.2508, the stop with this strategy can be placed at the level of 1.2830.If we receive a profit of 30 points or more, we fix 50% of the position, and put the rest at breakeven. If this forecast for the GBP/USD pair coincides with your opinion, then you can safely use this strategy.
  Forex forecast for USD/CADThe USD/CAD pair is trading within an uptrend on a 4-hour chart. It shows that the USD/CAD exchange rate is trading above the moving average with a period of 55 on the hourly chart (level 1.3509), which generally contributes to the price increase in the short term. I recommend working on this pair from sales based on the established wave model.The signal to open a long position will be a breakdown at the end of the resistance hour at 1.3568 in order to increase to the resistance at 1.3618 and in case of its breakdown at the end of the hour to 1.3678. Stop loss with this strategy can be placed at 1.3480.The signal to open a short position will be a breakdown at the end of the support hour at 1.3488 with the aim of reducing to support at 1.3429 in case of its breakdown at the end of the 1.3381 hour. The stop loss with this strategy can be placed at the level of 1.3595.Given that the moving average and the location of the boundaries of technical figures are moving over time, it is necessary to adjust their position on the hourly chart. I also recommend opening positions at the end of the hour to avoid false breakouts.Forex forecast for GBP/USDBased on technical modeling for the pound/dollar pair, a forecast of further movement has been formed and the average price is predisposed to decline.In this technical situation, the pound can be sold from the level of 1.2742, you can also place a pending sell order at the level of 1.2767 in order to decrease to the area of 1.2609-1.2508, the stop with this strategy can be placed at the level of 1.2830.In the case of a profit of 30 points or more, we fix 50% of the position, and put the rest at no loss. If this forecast for the GBP/USD pair coincides with your opinion, then you can safely use this strategy.
  Forex forecast for USD/CADThe USD/CAD pair is trading within an uptrend on a 4-hour chart. It shows that the USD/CAD exchange rate is trading above the moving average with a period of 55 on the hourly chart (level 1.3501), which generally contributes to the price increase in the short term. I recommend working on this pair from sales based on the established wave model.The signal to open a long position will be a breakdown at the end of the resistance hour at 1.3568 in order to increase to the resistance at 1.3618 and in case of its breakdown at the end of the hour to 1.3678. Stop loss with this strategy can be placed at 1.3480.The signal to open a short position will be a breakdown at the end of the support hour at 1.3488 with the aim of reducing to support at 1.3429 in case of its breakdown at the end of the 1.3381 hour. The stop loss with this strategy can be placed at the level of 1.3595.Given that the moving average and the location of the boundaries of technical figures are moving over time, it is necessary to adjust their position on the hourly chart. I also recommend opening positions at the end of the hour to avoid false breakouts.Forex forecast for British pound/US dollarBased on technical modeling for the pound/dollar pair, a forecast of further movement has been formed and the average is urgently predisposed to an increase.In this technical situation, the pound can be bought from the level of 1.2765, you can also place a pending purchase order at the level of 1.2730 in order to increase to the area of 1.2878-1.2987, the stop with this strategy can be placed at the level of 1.2650.In the case of a profit of 30 points or more, we fix 50% of the position, and put the rest at no loss. If this forecast for the GBP/USD pair coincides with your opinion, then you can safely use this strategy.
  USDCAD signalsUSDCAD is trading in a downtrend on the 4-hour chart. It shows that the USD/CAD rate is trading below the moving average with a period of 55 on the hourly chart (the level of 1.3462), which generally contributes to the decline in the price in the short term. I recommend to sell on this pair on the basis of the existing wave pattern.The signal for long position opening will be a break-down and fixing above the resistance at 1.3500 with the aim to go up to the resistance level of 1.3552 and in case of its break-down at the end of the hour to 1.3606. Stop loss in this strategy may be placed at the level of 1.3440.The signal for the opening of a short position is a break-down and fixation at the level of 1.3349 with the aim of going down to the support at 1.3295, in case of its breakdown an hour later, to 1.3243. Stop-loss in this strategy can be placed at the level of 1.3475.EURUSD signalsEURUSD is trading within the ascending price channel on the hourly chart. I recommend opening long positions in case the pair breaks through and rises above the resistance at 1.0810, aiming to the resistance at 1.0837-1.0869. Stop loss below 1.0760.I recommend to open short positions after breakdown and fixation below the support at the level of 1.0764 with the aim to go down to the support at the level of 1.0737-1.0710. Stop-loss is above 1.0820.GBPUSD signalsOn the basis of technical modeling on pair pound/dollar the forecast of the further movement was formed and the average urgency is predisposed to rise.In the given technical situation pound can be bought from the level of 1.2243 and also it is possible to expose the pending buy order at the level of 1.2170 with the purpose of increase in the area of resistance at the level of 1.2353-1.2446, the stop at this strategy can be placed at the level of 1.2070.
  USDCAD signalsUSDCAD is trading in a downtrend on the 4-hour chart. It shows that the USD/CAD rate is trading below the moving average with a period of 55 on the hourly chart (the level of 1.3479), which generally contributes to the decline in the price in the short term. I recommend to sell on this pair on the basis of the existing wave pattern.The signal for long position opening will be a breakdown and fixation at the level of 1.3500 with the aim to go up to the resistance at 1.3552 and in case of its breakdown and fixation at the level of 1.3606. Stop loss in this strategy may be placed at the level of 1.3440.The signal for the opening of a short position will be a breakdown and fixation at the level of 1.3349 with the aim of reducing to the support at the level of 1.3295 in case of its breakdown and fixation at 1.3243. Stop-loss may be set at the level of 1.3475.EURUSD signalsThe EURUSD pair is trading within the ascending price channel on the hourly chart. I recommend opening long positions in case of breakdown of the resistance at 1.0870 with the aim of going up to the resistance at 1.0900-1.0931. Stop-loss below 1.0800.I recommend to open short positions after breakdown of support at 1.0807 with the aim to go down to support at 1.0781-1.0751. Stop loss is above 1.0885.GBPUSD signalsOn the basis of technical modeling on pair pound/dollar the forecast of the further movement was formed and the average urgent predisposition to increase.In the given technical situation pound can be bought from the level of 1.2226 and also it is possible to expose the pending buy order at the level of 1.2122 with the purpose of increase in the area of resistance at the level of 1.2374-1.2494, the stop at this strategy can be placed at the level of 1.2070.
  USDCAD SignalsUSDCAD is trading in a downtrend on the 4-hour chart. It can be seen that the rate USD/CAD trades below the moving average with a period of 55 on the hour chart (level 1.3540), which generally contributes to the decline in the price in the short term. I recommend to sell on this pair on the basis of the existing wave pattern.The signal for long position opening will be a breakdown by the results of the hour and fixing above the resistance at 1.3446 with the aim to go up to the resistance level of 1.3500 and in case of its breakdown and fixing by the results of the hour - further to 1.3552. Stop-loss may be placed at the level of 1.3350.The signal for the opening of a short position is a breakdown and fixation below the support at 1.3362 with the aim of reducing to the support at 1.3317, in case of its breakdown and fixation at 1.3259. Stop loss can be set at 1.3455.EURUSD SignalsThe EURUSD pair is trading within the ascending price channel on the hourly chart. I recommend opening long positions in case of breakdown and fixation at the level of 1.0759 with the aim of going up to the resistance at 1.0785-1.0809. Stop loss below 1.0710.I recommend opening short positions after breakdown of support at 1.0720 with the aim to go down to support at 1.0696-1.0667. Stop-loss is above 1.0770.GBPUSD SignalsOn the basis of technical modeling on pair pound/dollar the forecast of the further movement was formed and the average urgent predisposition to increase.In the given technical situation pound can be bought from the level of 1.2147 and also it is possible to expose the pending buy order at the level of 1.2060 with the purpose of increase in the area of resistance at the level of 1.2344-1.2446, the stop at the given strategy can be placed at the level of 1.2040.