

Пара GBP/USD растет после оптимистичных данных по занятости
Фунт торгуется с повышением после обнадеживающих данных по занятости в Великобритании, восстановившись со вчерашнего минимума 1,30. Уровень безработицы снизился до 3,9% за 3 месяца до января по сравнению с 4,1% и превысил прогнозы в 4%. Безработица в настоящее время находится ниже уровня, существовавшего до пандемии, что подчеркивает напряженность на рынке труда.
Количество заявителей сократилось еще на 48,1 тыс. в феврале после падения на 31 тыс. в январе. Средний заработок, включая бонусы, вырос на 4,8% в годовом исчислении, что усилило инфляционное давление и усилило давление на Банк Англии с целью повторного повышения процентных ставок.
Доллар США падает по всем направлениям, так как доходность казначейских облигаций США снизилась, а инвесторы ожидают данных по инфляции ИЦП в США и завтрашнего объявления ставки ФРС.
Ожидается, что индекс потребительских цен вырастет до 8,7% в годовом исчислении в феврале по сравнению с 8,3%.
Где дальше будет курс GBP/USD?
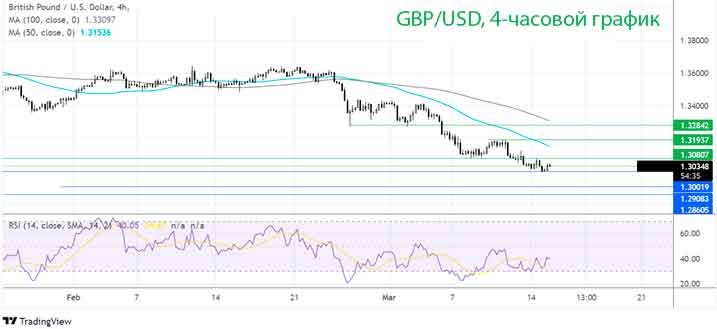
Пара GBP/USD вчера нашла поддержку на критическом уровне 1.30 и отскочила примерно до уровня закрытия пятницы 1.3030.
График по-прежнему медвежий, так как цена торгуется ниже своих 50 и 100 SMA на 4-часовом графике, а RSI остается ниже 50, что говорит о том, что впереди может быть еще один спад, который находится вне зоны перепроданности.
Продавцам потребуется пробить уровень 1.30, чтобы спровоцировать более глубокую распродажу к круглому числу 1.29 и 1.2820, минимуму ноября 2020 года.
Между тем, покупатели ожидают движения выше 1.3080, минимума 8 марта, чтобы выставить 50 sma на 1.3160 и максимум прошлой недели 1.32.
Индекс FTSE падает по мере того, как Китай блокирует все больше городов
Индекс FTSE и его европейские аналоги движутся к отрицательному открытию, отслеживая слабость в Азии в одночасье.
Китайские данные были оптимистичными: промышленное производство выросло на 7,5%, а розничные продажи подскочили на 6,7%.
Однако опасения по поводу роста числа случаев заболевания COVID и усиления ограничений на изоляцию во второй по величине экономике мира негативно сказываются на настроениях к риску и снижают цены на сырьевые товары по всем направлениям.
Нефть торгуется еще на 5% ниже, так что основные нефтяные компании, скорее всего, окажутся под давлением. Неблагородные металлы также страдают, поскольку в Китае, крупнейшем в мире потребителе металлов, 45 миллионов жителей заблокированы.
Мирные переговоры между Россией и Украиной также находятся в центре внимания и могут повлиять на настроения по поводу рисков в течение всей сессии.
Где дальше будет курс FTSE?
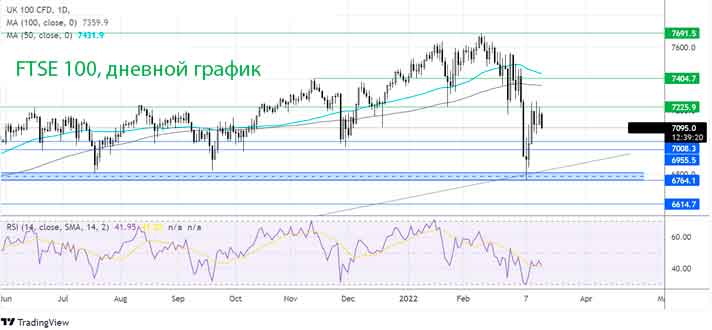
Вчера индекс FTSE столкнулся с сопротивлением на уровне 7225, уровне, который несколько раз оказывал поддержку и сопротивление в течение прошлого года. Продавцы вновь вышли на рынок здесь и снизили индекс до ключевого психологического уровня 7000.
RSI поддерживает дальнейшее снижение, пока он остается вне зоны перепроданности. Продавцы захотят увидеть прорыв ниже 7000, чтобы открыть дверь к 6950 перед 6820.
Покупатели будут искать движение выше 7225, чтобы выставить 100 sma на 7350 и 7400, максимуме ноября.

 Which commodities to invest in in the summer of 2021Aluminum prices have been rising throughout the year. According to COMEX, futures contracts are trading above 2600 USD this week, which is 44% higher than the level of January.According to S&P Dow Jones Indices, the annual total return of the Dow Jones Commodity Index Aluminum, which tracks the metal market using futures contracts, is currently 34%.The increase in prices seems to be due to two interrelated factors, both of which are caused by the problems of climate change. Aluminum producers are trying to reduce greenhouse gas emissions, so their production has slowed down. Meanwhile, demand is growing, because the metal is vital for customers who are also working to reduce emissions.According to Nick Snowdon of Goldman Sachs, this creates a "unique paradox" for the industry. "Aluminum is necessary for technologies such as electric cars and solar panels, but its production generates a lot of carbon – 2% of all global emissions," he said at the end of last week.TrendsTo combat global warming, the aluminum industry must develop low-carbon technologies. As a result, the increased cost will be shifted to the buyers. And higher prices "will be required to encourage steel companies to invest in cleaner production methods against the backdrop of growing demand and slowing supply growth."In fact, Snowdon said that demand for this metal is growing at the same time as investment in new facilities outside of China is decreasing due to the tightening of climate policy.A significant part of the demand for aluminum comes from the electric vehicle (EV) industry, and aluminum is also needed for the production of beverage cans, packaging, construction and aerospace industries.
  Billionaires called DOGE "the strongest cryptocurrency"Billionaire and owner of the Dallas Mavericks basketball team, Mark Cuban, spoke approvingly about the Dogecoin meme cryptocurrency, after which he was supported by the director of Tesla and SpaceX, Elon Musk. Against this background, the price of DOGE rose by 16% on August 16, it follows from the auction data.The sharp growth of Dogecoin began around 16:00 on August 15. Then DOGE was trading at $0.291, showing an increase of 5.5% at that time. In six hours, the exchange rate rose to $0.343. After that, the rapid growth of Dogecoin slowed down, but during the day the price of the coin reached $0.349. Thus, during the day, DOGE grew by 18%.At 16:00 on August 16, the cost of Dogecoin was $0.338, which is 16% of the price the day before.The jump in the value of Dogecoin occurred after a series of statements by Mark Cuban and Elon Musk. First, the owner of the Dallas Mavericks on August 13 announced special discounts on the team's merch for those who will pay in this cryptocurrency. On the same day, in a conversation with CNBC, the billionaire praised the coin:"This is a means that can be used to purchase goods and services. The Dogecoin community can be called the strongest when it comes to using the coin as a medium of exchange"Under the tweet with this material, the main supporter of the meme-cryptocurrency, Musk, was also noted, who wrote: "I've been saying that for some time now."On August 15, Cuban started talking about Dogecoin again. In a tweet, he explained why he considers the coin promising:"A very important detail about DOGE, which is often overlooked, is that the imperfection and simplicity of the coin are its strengths. You can only use the coin for two things: spend or keep. This is simple enough to understand. And DOGE is cheap to buy, which allows anyone to join the community"In March, the Dallas Mavericks club was the first in the NBA to accept Dogecoin for payment. Now you can buy tickets for matches, merch and food for cryptocurrency.
  Fundamental factors indicate that a new growth cycle is approachingThe cryptocurrency market continues its systematic recovery. During the past week, bitcoin managed to successfully gain a foothold above $42,000, which marked the final exit from the sideways trend, and at the moment the BTC/USD exchange rate is testing the resistance level around $48,000. Altcoins are also not far behind, which also break through key resistance zones. Fundamentally, there are also positive factors that indicate the approach of a new growth cycle. Our traditional weekly BTC/USD analysis will show what the upcoming week will be like.The Wall Street Journal draws attention to the fact that retail investors are again interested in cryptocurrency. The news that Amazon is looking for a leader in products in the field of cryptocurrencies has become a catalyst for a new surge of bullish sentiment among individuals and not only.According to the observations of Cryptomoon, each bull market in BTC is usually characterized by three waves of hodling. In the third wave, short-term hodlers begin to dominate. At the moment, most likely, only the first wave has ended, and two more are waiting for us ahead.At the moment, the BTC/USD exchange rate is preparing for a breakdown of the $48,000 level, which repeatedly kept the price from falling until May 19. The first attempts to overcome the level were unsuccessful, but there are no volume sales, only short-term corrections. This suggests that sellers are not ready to oppose anything to buyers who continue to increase their positions at the time of even the weakest corrections, according to the technical analysis of BTC/USD.After the breakdown of $48,000, the last important resistance remains the level of $54,000, which also for a long time beat the price to the area of $60,000 - $65,000. As soon as the $54,000 level gives up its authority as a resistance, the price can quite impulsively rush to update the historical maximum.Our forecast for the BTC/USD exchange rate for today, tomorrow and the week from August 16 to 22 — there is a high probability of a breakdown of the $48,000 level and an increase to $54,000. If it is not possible to break through $48,000, the BTC/USD exchange rate may return to the $42,000 area in the short term and impulsively, but after that, a retest of $48,000 will also follow.
  For the first time since the beginning of spring of this year, the indicators of weekly reserves of "black gold" in the United States showed values close to the average, which may indicate the return of the country's energy industry to normal. According to the American Petroleum Institute (API), weekly reserves decreased by 0.816 million barrels, and according to the report of the Energy Information Administration of the agency (EIA), the indicators decreased by 0.447 million barrels. This means that last week, demand balanced supply, which has not been observed in the last seven months.Along with the stabilization of the balance in the market, the asset quotes began to grow again, which does not quite suit the American government, which was counting on their deeper decline. This was announced yesterday by US President Joe Biden, calling on OPEC countries to return to discussing the complete rejection of production cuts. According to the head of the White House, this will reduce the price of gasoline for end consumers, which is impossible with high prices for raw materials.Support and resistance levelsOn the global chart of the asset, the price forms a correction pattern "triangle". Technical indicators hold a sell signal, but are ready for a reversal: the range of EMA fluctuations on the alligator indicator has begun to narrow, and the histogram of the AO oscillator forms ascending bars.Resistance levels: 70.10, 74.70.Support levels: 65.50, 62.00.Trading ScenariosThus, the analysis and forecast of oil prices for August 13-16, 2021 in the event of a reversal and continued global growth of the asset, as well as consolidation above the local resistance level at around 70.10, buy positions with a target of 74.70 will be relevant. The stop loss should be set at 69.00. The implementation period: 7 days or more.If the asset continues to decline, as well as fixing below the local support level at around 65.50, it is important to open sell positions with a target of 62.00. The stop loss should be set at 67.00.
  Against the background of the decline in the US dollar, the AUD/USD pair turned around and forms a local growth, trading at 0.7364.The head of the government of the capital district of Australia, Andrew Barr, announced the introduction of an immediate quarantine due to the fact that the first case of coronavirus in a Canberra resident in thirteen months was confirmed the day before. The authorities are afraid of the resumption of the pandemic in the country and are ready to go to any restrictions to prevent the spread of the disease. At the moment, it is difficult to imagine what this quarantine threatens the country's recovering economy, but if the virus cannot be contained, it can cause serious problems for companies that have just reached payback levels.The main influence on the dynamics of the instrument is still exerted by the US dollar, which began to decline the day before. The expectations of analysts and officials of the US Federal Reserve were not met, as consumer price inflation remained at high levels during the reporting period, and did not decrease as expected. The monthly growth rate of the consumer price index was 0.5%, while the annual indicator remained at 5.4%, and did not slow down to 5.3%, as expected. At a minimum, the value has stabilized, but this is not enough for the regulator to reconsider its rhetoric regarding quantitative easing.Support and resistance levelsThe price is trying to change the trend, forming a local side channel within the forex forecast. Technical indicators remain in the state of a sell signal: the range of fluctuations of the EMA of the alligator indicator has begun to narrow, and the AO histogram is approaching the transition level.Resistance levels: 0.7407, 0.7560.Support levels: 0.7321, 0.7200.Trading ScenariosThus, AUD/USD forex forecast for August 13-16, 2021 in the event of a reversal and growth of the asset, as well as consolidation above the local resistance at 0.7407, buy positions with a target of 0.7560 will be relevant. The stop loss is 0.7350. Implementation period: 7 days or more.If the asset continues to decline, as well as consolidation below the support level at 0.7321, it is necessary to form sell positions with a target at 0.7200. The stop loss is 0.7400.
  The US dollar is developing an upward trend against the Japanese yen during trading in Asia, updating local highs since July 14.Buying activity in the US currency remains very high, as the markets are widely discussing the prospects of curtailing the US Federal Reserve's stimulus programs. The baton of the inspiring report on the labor market, published at the end of last week, was picked up by a series of speeches by representatives of the regulator, who agree on the need for more active actions in the near future.The weak macroeconomic statistics from Japan provided additional support to the instrument today. Thus, the forecast of developments from Eco Watchers in July decreased from 52.4 to 48.4 points, while analysts expected a reduction to only 50.2 points.The focus of investors' attention today will be on American statistics on the dynamics of consumer prices. Recall that consumer inflation is one of the main indicators for the US Federal Reserve when choosing the course of monetary policy.Support and resistance levelsThe Bollinger bands on the daily chart show weak growth within the forex forecast. The price range is expanding, freeing the way for the "bulls" to new local highs. The MACD indicator is growing, maintaining a strong buy signal (the histogram is located above the signal line). Stochastic retains an upward trend, but is located in the immediate vicinity of its maximum values, indicating the risks of overbought dollar in the ultra-short term.Resistance levels: 110.68, 111.00, 111.34, 111.70.Support levels: 110.38, 110.00, 109.57, 109.29.Trading ScenariosThus, USD/JPY Dollar Yen forecast for August 12-13, 2021 to open long positions, you can rely on the breakdown of the 110.68 mark up. Take profit - 111.34. Stop loss - 110.38. Implementation period: 1-2 days.A rebound from the level of 110.68 as a resistance, followed by a breakdown of the level of 110.38 down, can be a signal for new sales with a target of 109.57. Stop loss - 110.80.
  Today, during the Asian session, Brent crude oil prices show mixed trading dynamics, consolidating near the $70.30 per barrel mark.The day before, the instrument was actively strengthening, compensating for the losses of the end of last week, when the dollar received an impulse to grow after the publication of a strong report on the US labor market for July. Nevertheless, the strong positions of the US currency continue to exert significant pressure on the oil exchange rate. In addition, investors are afraid of a decline in demand against the background of another surge in the incidence of coronavirus in a number of Asian countries, in particular, in China.On Tuesday, the published report of the American Petroleum Institute (API) provided moderate support for the instrument. For the week of August 6, energy stocks in US warehouses decreased by 0.816 million barrels after falling by 0.879 million barrels over the previous period. On Wednesday, in addition to statistics on consumer inflation, investors are waiting for the release of the final report on the reserves of "black gold" from the US Department of Energy.Support and resistance levelsOn the daily chart, the Bollinger bands are moderately declining within the framework of the forex forecast. The price range is expanding from below, freeing the "bears" the way to new local lows. The MACD indicator has turned in the direction of growth, but still retains a sell signal (the histogram is located below the signal line). Stochastic, on the contrary, demonstrates strong growth, signaling in favor of the development of upward dynamics in the ultra-short term.Resistance levels: 71.00, 71.80, 73.00, 74.00.Support levels: 70.00, 69.00, 68.00, 67.00.Trading ScenariosThus, the analysis and forecast of oil prices for August 12-13, 2021, long positions can be opened after the breakdown of the 71.00 level up with the goal of 73.00. Stop loss - 70.00. Implementation period: 2-3 days.Short positions can be opened after the breakdown of the level of 70.00 down with the goal of 68.00. Stop loss - 71.00.
  The US dollar shows a weak growth against the Canadian currency during the morning session after an active decline the day before, which was due to the appearance of technical factors, as well as the publication of not the most confident macroeconomic statistics. Thus, labor productivity excluding the agricultural sector in the 2nd quarter of 2021 slowed from + 4.3% to +2.3%, which turned out to be worse than analysts ' expectations at +3.5%. The NFIB business optimism index in July adjusted from 102.5 to 99.7 points, which also turned out to be worse than forecasts.Nevertheless, the US currency continues to strengthen as the comments of representatives of the US Federal Reserve come to the market, confirming the regulator's course for an early tightening of monetary policy. A more confident growth of the instrument is hindered so far only by statistics on the incidence of coronavirus in the United States and a number of Asian countries.Support and resistance levelsThe Bollinger bands on the daily chart show a reversal in the horizontal plane within the forex forecast. The price range is actively narrowing, reflecting the appearance of multidirectional trading dynamics in the short term. The MACD indicator turned down, forming a weak sell signal (the histogram is located below the signal line). Stochastic, having not risen above the "80" mark, turned down, reacting to the appearance of "bearish" dynamics last Tuesday.The current readings of technical indicators do not contradict the development of downward dynamics in the short and/or ultra-short term.Resistance levels: 1.2554, 1.2600, 1.2650, 1.2700.Support levels: 1.2500, 1.2439, 1.2400, 1.2352Trading ScenariosThus, USD/CAD forecast of the Canadian dollar for August 12-13, 2021 to open new short positions, you can rely on a confident breakdown of the 1.2500 level down. Take profit - 1.2400. The stop loss is 1.2554. Implementation period: 1-2 days.A rebound from the 1.2500 level as a support, followed by a breakdown of the 1.2554 mark up, may be a signal for new purchases with a target of 1.2650. The stop loss is 1.2500.