
Fluctuations in the stock market and Forex occur depending on two main factors, namely the technical aspect of the market and its fundamental aspect. That's why the vast majority of traders start their day by looking at the economic calendar for the upcoming session in order to best apply their strategy.
The importance of market calendars, or, in other words, the release schedules of the most important economic indicators, news and events, is disputed, perhaps, only by ardent fans of technical analysis. For all other traders, speculators and even investors whose investments are made for many years, it is not only useful, but even necessary to take into account the release of macroeconomic statistics, speeches by the heads of central banks and other events that can affect the movements of stocks, currencies and any assets traded on the market.
So, let's figure out what an economic calendar is, what it is for, how to use it, and what types of economic calendars should be familiar to every trader. A reasonable and responsible trader should understand why this or that strong movement occurred, which is often caused by the publication of statistical indicators or the speech of the heads of central banks or political figures. Possession of information about what is happening may not provide a direct advantage (since everyone receives this information at the same time), but at least gives an understanding of the nature of the movement.
What is an economic calendar?
The Forex and Stock Market trader's economic calendar summarizes the news and other important publications expected during the next trading sessions. These are the fundamental data that affect the price of small and large markets. That is why the economic news calendar is one of the first tools for analyzing a trader in various financial markets.
The trader will be informed about the following:
- The time of publication in accordance with his (the trader's) location.
- The origin of the news (in which country the event occurred and what is the source of the publication). For example, if the USD/CAD pair is one of the pairs you trade, you will be more attentive to the economic statistics of Canada and the USA.
- The importance of the news, namely, the impact on the relevant asset. If the impact is small, the price of the relevant currency probably will not have a significant impact. On the other hand, in the event of an important news release, there will be high volatility of the financial asset.
- The nature and wording of the news that will allow us to judge the nature of this event, whether it is Mario Draghi's speech from the ECB or unemployment statistics in the United States.
- Forecast results and statistics: historical data allows you to assess the evolution of events and compare them with the current market situation.
- With all this information, a trader can monitor stock market trends in real time, as well as trends in future currencies.
Read more: Features of successful Forex trading according to GDP data
How to use the economic calendar
There are many economic indicators that make up the economic agenda. The list of news that are considered highly significant will tell you how to read the economic calendar correctly.
US Economic Calendar
As for the US labor market, it is worth paying attention to the following news:
- A report on the creation of new jobs, which continues to create large movements in the markets, especially in the Forex market.
- Applications for unemployment benefits, in which the number of new applications is estimated and the corresponding amount is updated.
- The unemployment rate, which represents the number of unemployed in the country.
- NFP - creating jobs outside the agricultural sector.
Read more: How to trade on Non-farm Payrolls (NFP)
If we talk about the US economy as a whole, the following will be indicated in the Economic Calendar:
- GDP or gross domestic product, which is a measure of the total output, including goods and services of the U.S. economy.
The indicators of the state of production displayed in the calendar of economic news will be as follows:
- The ISM Manufacturing and Non-manufacturing index, which is an indicator of inflation and working conditions, allows you to assess the health of markets.
Consumer measures will be presented:
- Retail sales, which is a monthly indicator of retail sales. These data directly affect consumer spending and overall consumer confidence in manufacturing companies in the country.
News about real estate and construction will be as follows:
- Obtaining a construction permit and starting construction
- Sale of new houses.
Read more: What is the Consumer price index CPI
Price news:
- The representation of consumer prices measuring the range of goods and services is widely studied by market participants.
- Representation of prices of producers of goods
For the retail sector, the Stock Market Calendar will include:
- Trade balance, representing the difference between imports and exports of goods and services in a country.
Finally, for the area related to monetary policy, the following news will be included:
- The interest rate, which theoretically will have a negative effect if it increases, and a positive one if it falls for the relevant country and its currency.
- The rate of inflation, which is a change in the price index. This indicator corresponds to the consumer price index, which measures price changes for consumer goods and services over time.
- FOMC minutes, which are the report of the meeting of the Monetary Policy Committee of the Federal Reserve.
- Speeches and decisions on the Fed's monetary policy.
Read more: What is the Industrial Production Index (IPI)
Forex economic calendar in the European Union
From the point of view of the European Central Bank, the main news will be the following:
- Reports on monetary policy meetings (for example, the decision on key rates) and speeches by representatives of the European Central Bank.
To measure prices:
- The consumer price index in the Eurozone provides an estimate of inflation in the relevant area. This indicator can be determined by countries such as France, Italy, etc.
- Employment indicators. For example, attention will be paid to the unemployment rate (first of all, in Germany - the strongest country in the Eurozone).
The following events will also be measuring elements of the European Union's production efficiency:
German production orders
- The IFO index, which evaluates the position of companies at the moment and determines their future trends.
- The ZEW indicator (Zentrum für Europäische Wirtschaftsforschung) is very similar to the IFO indicator, but it concerns the banking sector directly.
Read more: The European Central Bank (ECB)
Forex economic calendar for the UK
Of course, there is a growth sector with GDP. But there is also a basic price indicator called the consumer price index (CPI), which determines inflation in the country. At the level of the labor market, the statistical report on the labor market estimates the levels of employment and unemployment, as well as the average wage index in England.
Finally, the manufacturing PMI in the field of construction and services will allow market players to learn about the evolution in these three main sectors.
Global economic calendar in Japan
In addition to the announcement of the GDP indicator for price indices, news about Japan will be related to the monetary policy of the Bank Of Japan (Bank Of Japan) and the publication of the interest rate and the minutes of the Bank of Japan.
Read more: History and functions of the Bank of Japan (BoJ)
Macroeconomic calendar
Probably, this calendar is the most global, and for traders in the Forex market it is of the greatest value. Macroeconomics affects absolutely all market segments and instruments from currencies and bonds to raw materials. The simplest example: a stronger-than-expected increase in inflation is likely to lead to a rise in the value of the currency, and a fall in the value of bonds, as expectations of higher rates will inflate the yield of these bonds. There are dozens of examples where a strong and unexpected change in the macroeconomic indicator entails a change in the prices of the entire range of instruments.
It is also worth noting that there are no clear rules and in different periods the reaction of the markets to the same event may be different. Another example: at the very bottom of the economic cycle, when the economy has just recovered from the previous crisis, an increase in rates by the central bank may prompt investors to think that the economy has begun to grow at a more confident pace and the central bank has finally gone to raise rates.
But a rate hike already at the peak of the cycle, when economic growth has been going on for more than a decade and rates have reached very serious values (as it was in 2006-2007, when the US rate reached 5.25%), will negatively affect the stock market. This is due to the fact that the cost of lending to corporations will become even higher and some businesses will simply be unprofitable.
In other words, in one situation, an increase in rates will inspire and cheer up investors a little, giving them a signal that the central bank is very optimistic and warns inflation by raising the rate, but in another situation investors will start to get rid of stocks, as excessively high rates can harm business by making the cost of borrowing too high, and the business will simply become unprofitable.
Read more: Purchasing Managers Index (PMI) - what is it and why an investor needs it
This means that the study of fundamental analysis and the economic calendar as a tool for evaluating fundamental data should be treated very carefully and thoroughly. There is no linearity and simplicity of judgments here.
After all, even the importance of the influence of certain instruments may fluctuate at different times.
For example, during the crisis of the early two thousand years, production problems were important, and the markets followed such data as industrial production and capacity Utilization, since after the dot-com crisis, the economy fell into a classic crisis with corresponding problems in production and demand. And already in 2008, due to the different nature of the crisis, macroeconomic indicators of the real estate sector, mortgage lending and statistics of related industries were considered more important. However, indicators such as inflation, gross domestic product, rates are always important and relevant!
Some calendars also indicate a Revised value, which at the time of publication shows how much the previous indicator value (let's say GDP) has been changed or revised. This often happens after the receipt of updated data, because it is not so easy to calculate the value of the gross product across the country.
To complete the picture, it is worth saying that the GDP statistics mentioned above are not the most important indicator. Much more serious movements are observed after the announcement by central banks of changes in interest rates and after the publication of data on the labor market (the latter is relevant for the United States)
Read more: Producer Price Index (PPI). Why is this indicator published?
Discount rate
The main event in the foreign exchange market is the central bank's decision on the rate. Undoubtedly, the rate level can be called the main driver of the foreign exchange market. All other things being equal, the currency becomes more expensive when the expectations for the rate rise and vice versa, the expected rate cut almost always leads to a decrease in the value of the currency.
We can even say this: almost all macroeconomic events should be considered from the point of view of changes in rates. For example, the release of relatively weak GDP data usually leads to a weakening of the currency, since most likely due to the weakness of the economy, the rate will be lowered or at least maintained at the same level.
Read more: What does the Fed rate affect?
Non Farm Payrolls
Every trader is looking forward to the first Friday of the month to get acquainted with the number of new jobs in the United States. The so-called Nonfarm is one of the most important barometers of the US economy, and job growth means future economic growth, because as a result, jobs create goods and services. And economic growth, in turn, will force the central bank (in this case, the Federal Reserve System) to conduct a "hawkish" monetary policy. This means that the dollar is likely to receive support.
But this relationship does not always work, and not only because significant multidirectional fluctuations can be observed at the time of data release. Sometimes external risks, even despite job growth, do not allow the central bank to tighten monetary policy. So it's not worth considering statistics linearly.
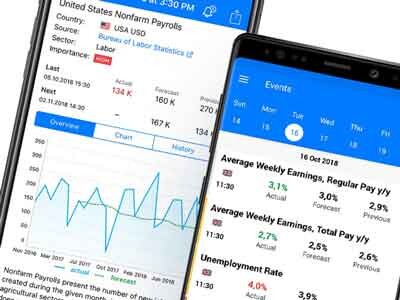
The economic calendar in MetaTrader
We are used to the fact that the resources where we watch the upcoming and current events of the week are on certain sites. In this interactive calendar, you can configure not only the time zone (by selecting a region), but also set a filter that, for example, will show only important news, as well as select the country or region whose currency you are interested in, and even the language in which indicators and the entire calendar will be displayed.
But few people know that the MetaTrader platform itself has a built-in calendar that shows all the parameters we need in the same way, starting from the analysts' forecast and ending with the exact time of the indicator's output. To open the built-in MT5 economic calendar, you need to press Ctrl+T and select the Calendar tab in the window that opens (as shown in the figure below).
Read more: Why are the MetaTrader 4 & 5 trading platforms so popular?
Economic calendar on charts
However, for some traders, even the calendar built into MetaTrader may not seem so effective, since it requires the trader to constantly switch tabs in the platform and does not show the time remaining before the news is released. Many traders prefer to trade according to the trend and do it in a relatively calm market, and during the release of important news they rather keep their positions closed.
And just for such purposes, you can see the moment of the news release right on the chart. At the same time, you can track both the news that has already been released and their impact on the market, as well as future indicators, and also clearly see how much time (candles on the chart) is left before the publication of the macroeconomic indicator. The figure shows an example where there are only a few hours left before the Personal Income data is released, all the published news is clearly reflected on the chart and you can see the market reaction to this or that news.
Read more: What is the Consumer Confidence Index (CCI)
Economic calendar - what news has an impact on the markets
If you pay attention to the third column on the left in the above table, you can notice multi-colored dots (one green, two yellow or three red). This symbolism, established by the compilers of the calendar, helps traders figure out which news will most affect the market and, as you can guess, three red dots are in front of indicators that are of the greatest importance, and one green, on the contrary, in front of macro-statistical indicators that almost do not affect the quotes of currencies or stocks.
Another detail or abbreviated designation may not seem quite clear: we are talking about the abbreviation: m/m, q/q or y/y (in English versions M/M, Q/Q or Y/Y). These letters mean the period for which the data is taken, or rather the period for which the indicator has changed. Let's say m/m means a change in the indicator relative to the previous month, and y/y shows an increase or decrease in the indicator relative to a similar one, but a year ago. For example, if inflation for April came out at the level of 2 percent yoy, it means that prices increased by 2 percent compared to April last year.
Read more: Basic knowledge of fundamental analysis
Economic calendars Forex - companies' reporting calendar
Traders and investors who trade stocks turn to a different calendar once a quarter, which reflects the company's reporting output. Every public company is required to publish its indicators once a quarter (earnings per share, turnover, net profit, and so on). Quite often, it is after the publication of these figures that stocks rise or fall by several, or even several tens of percent. Therefore, it is very important to know when companies whose shares are already in your portfolio (or you are going to purchase them) will publish a quarterly report.
In this case, the evaluation system works in much the same way as in the macroeconomic calendar: it is important to know what forecasts are presented by analysts and experts, that is, look at the forecast column and compare the already published figures with these indicators. Usually, if the fact is very different from the forecast in a positive direction - stocks are growing, and vice versa, investors' disappointment forces them to sell shares when the actual figures turn out to be worse than analysts' expectations.
But this is very approximate information, since in addition to reporting, companies often give their forecasts for the next quarter (the so-called guidance), and often these figures turn out to be more important than the data already published. This is understandable, because the new forecast from management, even if it is a forecast, reflects the vision for the next quarter or even half a year. And the future is much more important for investors than the past.
Read more: EPS: about Earnings per Share with examples in simple words
IPO calendar
This calendar is probably important only to those who are going to buy shares at the initial public offering. Actually, IPO (Initial Public Offering) means the Initial Placement of shares on the stock exchange. The entry of any company on the stock exchange is always a loud and important event in the stock exchange world. Before a company puts its shares up for auction, there are many stages, starting from the registration of the issue prospectus to the direct opening of trading in shares of this company and the first transaction. So the date when investors will be able to purchase shares on the stock exchange becomes known in a few weeks.
However, not every broker allows clients to purchase shares at an IPO, that is, even before entering the stock exchange, but anyone gives the opportunity to buy shares on the first day of trading. Sometimes the prices on the initial placement and on the day of trading differ by tens of percent. For example, the company Beyond Meat, a manufacturer of artificial meat, sold shares to investors at the initial public offering for $ 25 apiece, but in the first minute of trading on the stock exchange, the shares were worth $43. And the first day of trading was completed at $67 per share.
Read more: IPO of a company - mechanism, examples & strategies
Economic calendars - Upgrade/Downgrade calendar
As you know, the market is full of forecasts and recommendations. Most large investment houses and brokerage companies have their own analysts tracking entire industries and individual companies (stocks). From time to time, the analysts of these investment houses give clients and the public their visions in the form of recommendations. The form of these recommendations is quite unified, and it is possible to roughly define all recommendations into 5 categories: Aggressively buy (Strong Buy), Buy (Buy), Hold (Hold), Sell (Sell) and Aggressively Sell (Strong Sell).
This calendar works rather "after the fact", and it is impossible to know in advance when and what forecast the analyst will give, and from which investment company he will be. But we will learn about this recommendation on the day of publication (probably, the word "recommendation" is more appropriate than "forecast", although almost always in addition to the recommendation there is also a target level - target price, which one or another analyst expects).
How to trade considering the economic calendar of Forex market events
To determine a trading strategy with an economic calendar for a specific news, it is necessary to consider its importance and study the expected market reaction. Here are some approaches to managing the news of the economic calendar:
Prediction of results: here the trader will take a position in advance in accordance with the mood of the market. This approach is not recommended for daily (short-term) trading, but can be applied to trading on fluctuations with greater security.
Buy/sell scenario: This approach does not take into account the impact of news from the economic calendar, but only reflects the volatility caused by a major event on the economic agenda. The trader places orders above and below the price to enter the movement during the announcement.
Read more: How to participate in an IPO
Net monitoring of results: in this case, trading is carried out based on the results of news publications in order to track their impact on the market.
Expectation: After new historical data appears, you can join the trend resumption or introduce a new trend caused by the publication in question.
Of course, one of the most logical decisions is not to trade during uncontrolled events, but this, in turn, means the opportunity to miss a good trading opportunity. In any case, stick to your strategy and be sure to test it on a demo account before you start working on a real one.
How to integrate a trader's economic calendar into your trading strategy?
You can use the economic calendar in several ways.
Read more: The main components of a Trading Strategy
Economic News Calendar and Risk management
A trader who trades in the markets during the day can focus his attention on the Forex calendar to find out whether his current positions that are already open in the markets are at risk due to economic news. And if so, how much.
Economic news will allow such a trader to manage their positions for a relatively long period of time. and if so, how much. The economic agenda of the week will allow him to manage his positions for a relatively long period of time.
For a currency trader, the Forex economic calendar will be important in order to know in advance when the ECB will change its key rate, or to track any other news related to events that may affect currency pairs and issues related to monetary policy in general.
Read more: Rich history of the Bank of England
The economic calendar and the correct timing for entering a position based on its data
The news published in the economic calendar will help intraday traders find the right time to place orders. Such traders need strong volatility. Therefore, they need a specific indication of the time to open a position on Forex, to trade indices or commodities.
Economic calendar and structuring of your investment strategy according to its data
A swing trader who prefers technical analysis is more likely to use economic news to manage his exposure to risk, which implies exiting a position before the news is published if it is assumed that the latter will have a significant impact or will not affect the market at the moment.
Similarly, a fundamental trader trading on fluctuations will take this information into account to manage his portfolio and, possibly, conduct a transaction based on an analysis of economic results.
On the other hand, a day trader will use the news to search for quick and profitable movements, even if the risk remains unchanged for him.
Read more: What is the FOMC?
The most operational economic calendar
If you want to trade indices - for example, CAC 40, Nasdaq or DAX 30, real-time information about the stock market will be especially valuable for you if you know how to interpret the Economic Calendar. In order to become a trader, you need a good understanding of the basics of the market, as well as the behavior of the actors.
For example, the DAX30 Forex economic calendar will mainly deal with economic and financial news from the eurozone, the ECB, as well as major influences at the international level.
Of course, it is not recommended to take a position before the main event, especially if your entry point is very close to the exchange rate at the time of the announcement of the state of the economy. Such a simple understanding of the value of the information provided in the markets will allow you to avoid numerous losses on your trading account.
Read more: Causes of inflation and scientific approaches to their study
If you are attracted to the foreign exchange market, the online Forex economic calendar will allow you to be aware of market expectations and keep track of important events.
It is often noted that there is no direction in relation to currencies related to the euro, since market participants do not want to open orders as soon as they find out the results of the announcement. This reflection avoids certain ranges and therefore potential losses for the trend trader or real opportunities for traders who trade in the range.
What do you need to know?
The market does not always follow the logic of economic results, it happens that market participants expect some news, and the movement after the news is published is relatively calm or does not meet expectations. That's why only data from the economic calendar is not enough to take the right positions in trade.
Read more: What is Forex in simple words
Who will help you understand the data of the economic calendar?
If you have any questions about this type of trading strategy, you can ask them to our traders online during the live broadcast or in the comments after it ends.
Forex and the stock market are quite complex financial markets that depend on many external factors, and we will help you deal with them.
If you want to learn how to trade according to the economic calendar or use it in your trading strategy, take your time and do it first on a demo account.
This will allow you to track the impact of the economic agenda on online investing and will help you pay more attention to this data, which affects the prices of currencies and other financial instruments.
Forex economic calendar - Conclusion
It can be unequivocally stated that a reasonable investor or speculator is obliged to know about upcoming events in the market. In order to avoid misunderstanding of the reasons for the appearance of a strong movement, it is very useful to have a clear timetable for the release of, for example, macroeconomic indicators. This is even more relevant in the case of stocks that report quarterly: even if you are an investor and are going to hold shares for a long time, it is useful to know how the company feels and what its profits are. And any strong movements will not come as a surprise to you, you will at least know that they are related to the released company data.
Of course, no calendar will give you an understanding of the direction of movement, will not determine the trend and will not tell you where to put a stop loss, but calendars are not designed for this at all. Follow the news and statistics and be aware of upcoming and past events.
Read more: The DAX index – history of its creation, structure and features
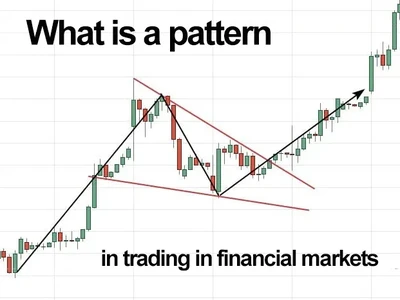 Geometry in financial marketsTechnical analysis is a serious method of forecasting the movement of asset prices on the stock exchange. Its adherents believe that all the events, news, emotions and decisions of the exchange participants are already embedded in the price that the trading chart displays.Unlike fundamental analysis, economic calendars, news feeds or financial ratios are not used here. The main weapon of technical analysis is a pattern: a model, a sample. A pattern in trading is any figure formed on the chart by a price or indicator.The fundamental rule of this type of analytics is that history repeats itself. When a technical analysis figure appears in the trading terminal, the trader understands that the price is likely to behave the same as in most cases when this pattern appeared on the chart before.ClassificationTraditionally, trading patterns are divided into three types. The main criterion by which a figure gets its place in the classification is the direction of price movement after the pattern is formed.Figures of uncertainty. Two-sided shapesThis includes all the figures of technical analysis that can talk about both the continuation of the trend and its reversal, depending on the slope of the pattern lines relative to the direction of the current trend. The main representatives of this type of patterns are the wedge and the triangle in all their diversity."Wedge"In the growing trend, you can see two types of these figures: bearish and bullish "Wedge". Both models are formed by the narrowing of the price channel. The bullish "Wedge" looks like a small correction on the growing chart: local lows are updated, but the price in the range slows down. The highs and lows of the wedge are getting closer. For a trader, the signal to buy an asset will be the breaking of the upper limit of the descending "Wedge", bullish.Fig. 1. A descending "Wedge" on a growing chart.A bearish "Wedge" is formed similarly, but with an update of the highs. The price is slowing down, the range is getting smaller. This model signals a trend reversal or indicates a subsequent correction.Fig. 2. Bearish "Wedge".For a downward trend, the pattern is identified in a mirror."Triangle"Some analysts and resources attribute this pattern on the stock exchange to trend continuation figures. Practice shows that after the appearance of a "Triangle" on the chart, the trend can change direction. It depends on the shape specification. Traders and investors most often use two types of "Triangles":Ascending - has a horizontal resistance line, which is periodically tested by the price. At the same time, the lows are fixed higher with each wave, making the price range narrower. To enter a long position, traders use the fact of a breakdown of the resistance line of the "Triangle", or a subsequent rollback to it;Fig. 3. The ascending "Triangle" on the Apple stock chart.Descending - one of the sides of the pattern is formed by horizontal support, and the second by decreasing highs. This is the complete opposite of the ascending "Triangle". Entry points to the sale can be searched immediately after the breakdown of support or a rollback to it.Any of the two patterns can be formed both on a bearish movement and on a bullish one, so they belong to universal figures.Fig. 4. The descending "Triangle" on the Walmart stock chart.Continuation figuresIf such patterns as "Pennant", "Flag" or "Box" appear on the monitor screen, it is highly likely that after the figure is implemented, the price will continue to move in the same direction."Pennant"This pattern is often called a "Triangle" on the stock exchange, because it is formed in almost the same way. The price range fades with each change of direction, drawing a narrowing corridor. The difference is that the upper border of the "Pennant" is directed down, and the lower one is up. The figure can often be detected after strong impulse movements of the asset towards the main trend.The signal to enter the deal appears after the breakout of the pennant border in the direction of the main trend. For a downward trend, the situation is mirrored.Fig. 5. "Pennant" on the growing chart of Moderna shares."Rectangle": corridor, range, consolidationThe range consisting of horizontal support and resistance, into which the quote falls after strong price impulses. For example, after the release of important news. The asset in the corridor takes a break after a rapid movement. The longer the price stays in the range, the more likely it is to break through its boundary. The points for entering the deal should be searched after the breakdown of the boundaries of the "Rectangle" or their subsequent testing.Fig. 6. "Rectangle" in a downtrend."Flag"A continuation pattern that resembles a "Rectangle", but directed by borders against the main trend. It often appears after strong movements on the chart and shows that the bears mistook a small correction for a reversal and some sellers open positions. At some point, buyers start fighting again, the channel border breaks through, and the trend continues to move in the old direction. To enter the transaction, the fact of the breakdown of the boundaries of the "Flag" in the direction of the main trend is used.Fig. 7. "Flag" on the graph.Reversal patterns in tradingSome figures become harbingers of a change in the current trend or a serious correction. Often such patterns occur at historical highs or at strong support or resistance levels."Head and shoulders"The most well-known and used figure of technical analysis in all stock markets. The formation consists of three peaks, of which the middle one is the highest, and two at the edges are approximately at the same level. The pattern schematically resembles the silhouette of human shoulders and head. At the same time, the location of the "Shoulders" at different heights is allowed. The signal to enter the trade is the breakdown of the "Neck" line or its test after the breakdown. For a downtrend, the figure is formed in a mirror.Fig. 8. "Head and Shoulders" on the graph.Double and triple tops, double/triple bottomOne of the main rules of trading is not to buy an asset at the top, but to sell at the bottom. The following patterns are often formed in areas where the security has nowhere to fall or grow.The figure represents two or three tops, bottoms that stopped at the same level, after which the price returned to the last minimum or maximum, and broke through it, turning in the other direction.Fig. 9. The triple vertex on the graph.A double peak is formed similarly to a triple one (Figure 9), with the difference that the support line breaks through after the second peak. Entry points can be searched both after the breakdown of the level and after its subsequent testing.For the double/triple bottom pattern, the situation is mirrored.The above examples of patterns in trading are the main and most common. Using these technical analysis figures in your trading strategy, you should remember that they are not the Holy Grail of trading. It is possible to increase the percentage of accuracy of the price movement forecast by including patterns in complex strategies.
  Brokers are offering more and more services and different types of accounts, which often confuse beginners. An ECN forex account is a type of order execution that takes trades directly to the interbank market. Let's consider how to operate correctly in this environment and whether it is profitable for traders.What is an ECN account?Electronic Communication Network is translated from English as "electronic communication network". This is a platform where requests from all market participants are displayed. Transactions are executed between them without third parties.Differences from the standard oneUp until 10 to 15 years ago it was very common for a broker not to take positions to the market. Counter orders were closed internally. Such situation led to the conflict of interests between trader and broker. As the broker was directly interested in losses of the client.When trading using the ECN account on Forex the deals are sent to the platform, to which the counterparties are connected. The broker is not involved in the transactions and has no influence on them.In the processing centre, buy and sell orders are combined into a common Depth of Market and executed automatically, without intervention by intermediaries.ParticipantsPositions are traded on the interbank market, where both individuals and firms conduct transactions:Private traders.Central and commercial banks.Hedge funds.Corporations.The ECN platform is provided by the organisation that owns the software. Today it has a portfolio of clients from 40 of the world's major banks.FeaturesThe difference between ECN accounts and conventional accounts is that the intermediary is not involved in transactions. Because of this, the platform provides low spreads. The spreads are variable and can increase during times of high instrument volatility or when there is less liquidity in the market. Normally it is between 0 and 5 pips.As the company cannot make profit on spreads, there is a commission for transactions. This is a fee for connecting to the interbank market and stable operation without failures.Even with these fees, low spreads make trading more profitable than in standard conditions.Usually the fee is specified as a fixed amount per turnover of $1,000,000.Read more: What are the Forex platforms and which one to choose for tradingAdvantages and disadvantages of ECN accountsTo understand whether or not a trader requires special terms of service, you need to know the pros and cons.AdvantagesECN in forex is beneficial because:Automation helps eliminate non-market quotes. Transactions are made at the best prices.Low spreads from 0 pips make intraday trading and scalping profitable.Speed. Positions are executed instantly with no requotes.Ability to set orders within the spread.No broker influence. As orders are executed without intermediaries, this excludes interference and fraud.Such trading conditions are suitable for scalper and pips strategies, when the aim of one trade is several pips. The high speed and low spreads allow for maximum profits.DisadvantagesTraders have found disadvantages that intermediaries are silent about:Floating spreads increase to too large a size during economic news releases, at night, on public holidays or on cross-currency pairs.Commission. Some intermediaries charge high fees.Slippage occurs at times of high volatility, when price changes in milliseconds.High minimum deposit amount. If on standard conditions a deposit from $1 is allowed, here the rules are different.The leverage is lower. The ratio of 1:1000 is not accepted.These trading rules are more suitable for professionals who are interested in the speed of execution and withdrawal of orders to the interbank. Beginners can use standard or cent options to work with minimal investments.Read more: Top 5 crypto trading bots - trade on the signals of experienced tradersCriteria for choosing a brokerSome companies offer clients to open an ECN, but in reality do not take trades to the interbank. Orders continue to be executed by an intermediary. And the special trading conditions remain only in the advertisement. The trader thinks that he works on the real currency market.What are the signs of the account that help to understand that clients are not being cheated:Low spreads within market averages.Less leverage than usual - 1:200 or 1:500.Increased minimum deposit. Requirements - from $300-500. If special conditions are allowed for a $1 deposit, this may be a scam.There are no limitations on the minimum time of holding a position.Execution of orders on the market (Market Execution).Availability of commission for transactions.The speed of work is higher than in standard accounts.These features indicate that the company does take the client's positions to the interbank market. It is good if the broker names the specific platform on the website through which operations are conducted. But this information is rare and intermediaries are not obliged to inform the clients about it.ECN broker receives profit in the form of commission. He is interested in the trader conducting more operations.Regular kitchens get their clients' money when their trades are unsuccessful or the deposit is wiped out. From this point of view ECN companies are more reliable.How to open an ECN accountAfter choosing a company, you need to create a trading account. How to do this:Register on the website.Choose account option.To file an application to open an account.Fund in the account in a suitable way.Usually the operation is instantaneous. The trader receives a login and a password which must be entered into the trading terminal.Some brokers allow selecting a counteragent, through whom the trader's deals will be performed. It is better not to determine the particular company. Because conditions for opening a position at the moment may be unprofitable.It is more convenient to use the liquidity of all participants of the platform.Read more: 15 forex trading signals for beginners that you need to knowBottom lineECN accounts are a good alternative to the standard options. They are ideal for traders who want to trade directly in the interbank market. Even with the broker's commission, these trading conditions are more profitable than the standard ones. And low spreads and high speed of order execution will increase profitability of trading. Scalpers and those who use high-frequency trading robots will find these features particularly interesting.
  A recession is an extremely serious and prolonged period of dropping economic acts and data that affects an entire country or even a group of them. It has far-reaching and serious consequences that affect the country's citizens, governments, companies and investors.There is no unambiguous meaning of a recession, but it is usually characterized by a decline in a country's economic activity, including a drop in industrial production, unemployment, national GDP, sales and real income. Statistical agencies usually specify that a decline in GDP must be observed for at least two continuous quarters.Recessions are thought to be a standard component of the business cycle and occur approximately every 7 to 9 years. However, experts have no consensus on how long an economic downturn can last. Typically, a recession that lasts more than 100 consecutive days can be classified as an economic downturn, that lasts fewer than 100 days can be classified as a correction or a bearish trend. But if the economic downturn stays for much longer, several months or quarters, it can be called otherwise as an economic depression, which can last from years to even decades, and also have more serious social negative consequences.What is a double-dip recession?A dual recession is an economic downturn that leads to a brief rebound, temporary economic growth, and then a recession again. This appears to be when economic recovery indicators, such as several positive months of GDP growth, are interrupted by the following economic downturn.Dual recessions are very rare in practice. There is only a single example of a dual recession which occurred in the United States in 1982. It was brought about by a skyrocket in oil prices as per the decision by the OPEC oil cartel embargo. When the U.S. economy started to repair itself, the Fed sharply increased bank rates to curb growing inflation. Central bank rates then peaked at 21.6% and triggered an additional surge of the economic downturn in the United States.Lately, the European Union experienced a dual recession as the outcome of the COVID-19 pandemic. Europe's economic indicators dropped at the beginning of the COVID-19 pandemic, but growth resumed in early 2021 - and France's economy rose by 0.4%, for example. But another surge in disease brought the rebound to be only in the short term, and by April 2021, the eurozone's economic indicators had fallen once more by 0.6%.Read more: Features of successful Forex trading according to GDP dataWhat are the causes of recession?Recessions are specifically brought by economic downturns, which come as a result of different kinds of factors, including:Economic shocks - these occur when there is an unexpected crisis that leads to major financial complications. The most recent and well-known example is the COVID-19 outbreak, which has caused major economic downturns around the globe.Declining income and rising debt - when personal income falls, citizens have to switch to other origins of finance, mainly credit. As debt levels rise, the bankruptcies number rises, which can undermine the economy. This is exactly what occurred with the bursting of the real estate bubble that brought the financial crisis in 2008.Bank Withdrawals - when there is news that a bank may go bankrupt, this event can cause a significant number of bank customers to pull out their money from the bank. Unsupervised runaway withdrawals from banks can lead to bank failures and growing fear in the banking and financial industry. A mass consumer panic could also cause an economic downturn.Hypothetical asset bubbles - when the price of financial assets is inflated above their objective value, this is called a bubble. As a result, prices become volatile, often causing them to plummet. The following panic among market participants can cause companies and independent individuals to sell most of their assets and decrease risk.Trading during a recessionYou can open both long and short positions when you trade with derivatives. This leads to the benefit from both the downside and upside of the market.It is essential to mention that while volatility can provide new profit opportunities, it can also cause serious risks. It is well known that asset prices can fluctuate wildly while in a recession, which means that potential profits may become losses.This is especially true if you opened a short position while in an abrupt fall, but your forecast was wrong and the market rallied instead of falling. The size of resulting loss you may incur can be very large.Therefore, it is crucial to adopt risk management actions, such as setting an insurance stop loss, to protect trades from large losses if the market resists you. When you trade leveraged financial tools such as CFDs or forex, your possible losses can also increase, so it's essential to neglect the possibility of losing capital at an amount greater than you can afford to waste.Now let's see a few different types of assets and their reaction to a recessionIn a recession, what happens to the bonds?Prices of government bonds typically rise in an economic collapse. They are referred to as a safe haven from loss during an economic drop. The study found that government bonds increased 12% during the economic collapse in 2008 and 8% during the technology crisis from 2000 to 2002.The reason for this is that the bond market is future-oriented and shows investors' forecasts for the future. Thus, it turns out that by the time the economic collapse appears, much of the losses for the bond market are already factored in, and investors are expecting the post-recession recovery level.Central banks also choose to purchase bonds as part of their actions to stimulate the state economy by altering monetary policy. This usually coincides with a decline in central bank interest rates.On the other hand, not all bonds decline in an exact manner. It is important to analyze a bond's yield and how it relates to bank rates. For instance, bonds that were issued a long time ago have higher yields and they usually do better in a low-bank-rate situation due to their more appealing than recent bonds with lower yields.After the economic decline is over, when bank rates start to grow and monetary stimulus packages finish, then fresher bonds may have greater yields.It should be clear to recognize that junk bonds do not perform exactly as government bonds because of the difference in attitudes toward them. Junk bonds are considered less stable and more unsafe investments, while government bonds are usually thought of as more stable, especially when issued by countries with stable economies - such as Japan, Germany and United States.Read more: What is a Bond: types, risks, difference from stock, pros and consIn a recession, what happens to commodities?Typically, when an economy slows down, industrial output falls due to a decrease in infrastructure projects and new housing construction, which leads to a drop in demand for basic goods and lower prices.The value of some commodities while in an economic downfall, such as metals for industry, farming goods and energy, depends on if they are decayable or not. If a commodity cannot be held for a prolonged period of time, its value is likely to fall while in a recession when demand for it falls. This will be supported by a subsequent decline in production and viable storage problems.We remember the consequences in April 2020 of oil storage overflows when the highest volume of crude oil ever was left at the seaports. The oil glut caused global anxiety in the markets, and the price of WTI crude fell below zero for the first time, because investors were afraid that they would have to handle the supply of oil themselves.But prices of some basic resources react variously - especially as they are thought of as a storehouse of elemental value. This is usually the case for gold (XAU) and silver (XAG), but also for other metals with high demand like palladium (XPD) and platinum (XPL).In a recession, what happens to the gold?Purchasing gold while in an economic downturn is often seen as a beneficial decision because of its name "safe haven." For instance, during the 2008 collapse, when S&P 500 fell by 37% in value, the value of gold increased accordingly by 24%.The conventional wisdom is that metals retain their value and value in economic collapses due to the constant demand for them if government banks hold gold or from industries that do not always experience recessions exactly - such as technological advances and medicine.But, this connection became a self-exploration prophecy of sorts. Investors believe that gold is a safe haven, which is why it acts that way.It's crucial to mention that gold may not always grow in recessions like in other markets, gold prices experience both peaks and troughs-but it is thought to be more stable than stocks.One can open a gold position in many various ways, like by purchasing gold bars and coins made from precious metals suppliers, focusing on ETFs, trading CFDs or futures.Furthermore, whenever you open a position while in a recession, it's important to know the risk. Markets can adjust rapidly, and even well-known safe havens can take traders off guard by sudden, unpredictable price movements.In a recession, what happens to the stock market?Usually, the stock market is known as an indicator of the health of an economy because it reveals to us how easily companies can access national capital and how actively individuals invest in risky assets. Not surprisingly, while in an economic collapse, the stock market drops as investors exit the riskiest assets.On the other hand, there are categories of stocks that become leaders while in financial market downturns due to their gain and rise disregarding of the economic cycle. Such stocks are named "defensive stocks," and they usually include telecommunications companies, utilities, health care and consumer staples. The products that these companies offer are considered vital, so these companies keep on making strong sales and steady gains while other industry sectors experience the entire negative impact of the drop.Nonetheless, a stock market fall is not always equivalent to an economic downturn, specifically, if the drop is contained inside the market-it could simply be a local correction or a bearish trend for other reasons. Actually, many economists think that the stock market itself is not an adequate indicator of a nation's economic boom.Do gold stocks rise in a recession?Simply said, yes, gold stocks tend to rise in price while in a recession. While most parts of the stock market may fall under a recession, gold generally increases in value. This leads to gold mining and production companies getting a boost.On the other hand, changes in the price of gold stocks depend on their financial act and investor sentiment towards them. Therefore, there is no assurance that each gold stock will grow in price. You need to do your own analysis of the fundamentals of each company individually.In a recession, what happens to the forex market?Forex is completely immune to an economical collapse unless each country is destroyed by an economic collapse, traders will find a way to exploit the difference in power between the two currencies.Some currencies or groups of currencies will eventually fall as their national economies collapse in the recession. However, other currencies may take their place. Essentially, forex trading requires long positions in one currency and short positions in another, so forex traders can simultaneously trade the currency of a country whose economy is both in crisis and thriving.When a nation's economy goes into recession, central bank rates fall, making the country's currency less attractive for investment. Typically, currencies with low bank rates are used to purchase currencies with higher interest rates - a so-called carry trade technique.Meanwhile, as the economy repairs itself from the crisis and bank rates grow, the national currency begins to build up as international and national investors will seek to store their money in that country's banks or buy its currency.Read more: Causes of inflation and scientific approaches to their studyWhen was the last recession?The last economical downturn was in the middle of 2020 in the U.K. For the first time in 11 years, the economy reserved 20.4% from April to June 2020. The COVID-19 virus that began led to a sudden drop in household spending, a drop in industrial production in factories and construction, and a halt in transportation and travel, causing GDP to drop for two continuing quarters.Eventually, the economy did recover, and although there were renewed fears of a second dip in 2021, the GDP chart stayed securely in the shape of a "V." But, the lingering uncertainty in the economy has raised fright that another downturn could occur in 2022.The last considerable economic collapse was the financial crisis in 2008 which started in December 2007 and carried on till June 2009. By that time, it was the most lengthy recession since WWII. It was brought about by the catastrophe in the housing market, which was caused by poor control of the mortgage market in the United States.Even though it began in the U.S., it rapidly spread throughout Europe, including Great Britain, Germany, and France, as well as Asia.
 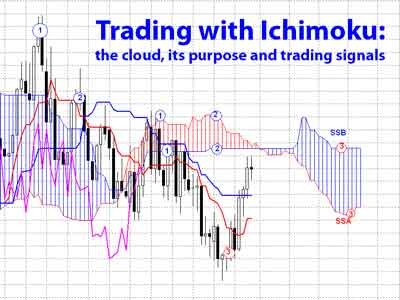 If you already have basic knowledge of how to work in financial markets and are on the verge of building your own trading system, I recommend studying the Ichimoku indicator. The Ichimoku indicator combines the power of five lines and Japanese imagery. Currently, it is becoming more and more popular among traders, being a solid foundation of their trading systems. This indicator can also help you achieve success and gain financial independence.Senkou Span and the Ichimoku CloudLet 's recall the definition of these lines:Senkou Span A (SSA) - the middle of the distance between Tenkan-sen (TS) and Kijun-sen (KS), shifted forward by the value of the second time interval.Senkou Span B (SSB) - the average value of the price for the third time interval, shifted forward by the value of the second time interval.Translated from Japanese – "riding, galloping ahead of the carriage."We have already said that the main lines of the indicator are the levels of a 50% pullback at various time intervals. They allow you to dynamically track the levels of these pullbacks, i.e. the possible values of trend corrections. The lines also make up a set of support/resistance levels of various strengths, their analogue can be considered a set of moving averages.Read more: What is Technical Analysis and why does an investor need itThe author of the indicator, Goichi Hosoda, conceived Senkou Spans as future levels of resistance and support, which draw a zone of predominance of the interests of market participants.Picture 1. SSA and SSB lines.Senkou-Span A gives us information about the short-term trend in the market. Its direction is recommendations for choosing a strategy: buy or sell. SSA is directed up – buy, down – sell. Finding the SSA above the SSB is a bullish market, under the SSB is a bearish one. Its second function is to act as a resistance or support level. However, the author of the indicator, Mr. Hosoda, considered this line weak for such a function, but this role cannot be ignored when analyzing the work with the chart.Senkou-Span B – unlike SSA, Hosoda paid more attention to this line. Having a larger time interval parameter, it, like Kijun Sen, carries the function of providing information about long-term trends in the market. Its direction, like all lines, gives us the choice of the direction of entry into the market. And the resistance/support function gives us the opportunity to find entry points into the market.And a very important point is that the exit of this line in the horizontal direction signals us about the end of the momentum of movement, a possible flat and a likely change in trend. Which gives us the opportunity to be ready, under certain conditions, to exit the market.However, the uniqueness of the indicator is that these two lines tell us about the future. Their mutual location, the location of the price, the fifth, not yet considered by us, the Chinkou Span and Kijun Sen and Tenkan Sen lines relative to them give us a lot of information about the market, its condition and prospects.Ichimoku Cloud and how to use itThe author of the indicator, Goichi Hosoda, conceived Senkou Spans as future levels of resistance and support, which draw a zone of predominance of the interests of market participants. According to Hosoda's plan, a change in the color of this zone signals a possible trend change or at least a rollback (correction).Look at Picture 2. If we analyze it carefully, we will see that this is indeed the case: the changed color of the cloud allowed the indicator user to see changes in market sentiment almost at the very beginning of this action. This signal is the most significant asset of the Ichimoku indicator.Picture 2. We track changes in trends using the Ichimoku cloud.If we look at Picture 2 again, we will pay attention to the fact that clouds look different not only in color, but also in shape. This form is set by the mutual arrangement of SSA and SSB. The unidirectional movement of the Senkoi in a direction other than horizontal tells us about the strength of the trend. The steeper the angle of the cloud movement, the stronger the trend and momentum of the market movement. The exit of these lines to the horizontal signals the equilibrium in the market (flat) and a possible change in the trend.Read more: Technical analysis on the forex marketHowever, here it is necessary to note such a moment as the width (thickness) of the cloud. The strength of the momentum of movement sometimes gives a negative reflection. It's like at the front. When a powerful, strong, fleeting blow leads to the breakthrough of all the enemy's resistances and withdrawal to his rear, but at the same time the rear of the attacker himself becomes very vulnerable. Because there are a lot of opponents left in them, and the attacker's reserves are far behind.So it is in this situation. With a powerful pulse, the thickness of the cloud is minimal, sometimes SSA and SSB merge into one line. These places are the most vulnerable to a breakdown when trends change. A more systematic, long-term movement, with reasonable pullbacks, draws a very "thick" cloud, which becomes very problematic for those who decide to change trends in the market. The thicker the cloud, the more interests there are of those who "drew" this cloud, and they just don't give up without a fight.Important. At the same time, it is necessary to note a very important point in the combination of these lines. When the SSB goes horizontal, and the SSA continues its directional movement, it means that we have only a weakening of the momentum of movement, but not a trend. At the same time, the Ichimoku cloud is expanding, which means that the prevailing interests in the market are expanding both in time and price ranges.In addition, the cloud carries another wonderful function. It, figuratively speaking, forms areas of "high" and "low" pressure. Acting as support and resistance, cloud lines form areas of interest for market participants. When the price is below the cloud, we are talking about the predominance of bearish trends in the market and, accordingly, the prevailing recommendation will be "sell". When the price enters the zone above the clouds, the bulls will have the initiative in the market, which means that we will stick to the buying strategy. At the same time, the cloud has another remarkable property. Inside it, the interests of bulls and bears intersect, consensus is established in the market, or maybe, on the contrary, there is a massacre and no one wants to give in, and we are seeing a flat.Ichimoku Cloud Trading SignalsWe have already briefly familiarized ourselves with some of the signals that the cloud and its components give us. Now let's look at this action in more detail. Let's start with the simple ones.Independent signals from SSA and SSBTrend signals:1. Recalculation of SSA and SSB. As we noted above, the most important signal for determining the trend from the Ichimoku indicator is the moment of intersection of the SSA and SSB lines, and the next change in the color of the cloud. An important condition for confirming this signal is the unidirectional movement of SSA and SSB following the intersection in the direction of the signal direction. The SSA will help with this. SSA is directed up – buy, down — sell.Read more: Features of intraday trading on the Forex market2. Unidirectional movement of SSA and SSB. As we have already noted, SSA is an indicator of the short-term trend in the market, and SSB tells us about the long-term preferences of the market. Therefore, when short-term and long-term trends coincide, we get their strengthening. Therefore, this signal itself is very strong. With a directional movement other than horizontal, this signal allows us to determine both the beginning of the trend and its continuation in a timely manner, thereby allowing us to enter the market in those conditions when we missed the beginning of the trend.3. SSA and SSB oncoming trafficPicture 3. Oncoming traffic.This action of the lines occurs at the moment when a rapid and final end of a long-term trend occurs in the market and precedes their crossing soon. This signal can also be used to take profits on the previous movement and enter the market in a different direction.Reversal (correction) signalPicture 4. Reversal (correction) signal.A reversal trading signal in this combination of Ichimoku indicator lines is issued by SSA. Being an indicator of short-term trends, SSA gives us the opportunity to timely determine the moment of exit from the trend, and catch the entry point into the market in new conditions.Conditions for the signalIf you look closely at Picture 4, you will see that by this time the SSB had already moved from directional movement to horizontal, which should have indicated a weakening of the momentum of the previous movement, and we should at least have expected a rollback (correction) of this movement. This is the first phase of the signal. Then, after a while, confirmation of this signal follows, the SSA is directed in the opposite direction of the movement and the price gives a reversal. Let's take an example of the work of SSA and SSB.Picture 5. An example of the reversal signal.Somewhere behind the scenes, the beginning of a bearish trend remains. Then SSA and SSB went horizontal (pos. 1), which corresponded to a short flat movement. Then the SSA and SSB turned down simultaneously (pos.2). We received a signal to continue the downtrend, and the opportunity to enter the market. After a while, SSB went horizontal, a signal of slowing momentum and a recommendation to be ready to exit the market, but SSA continued its downward movement, recommending that we hold the position.Then the SSA turned up (pos. 3), a signal of a change in trend (or correction) and exit from sales positions. Recommendation to buy. After a while, the SSA also entered the horizontal, advising us to be ready for the end of the correction and recommending that we exit the purchases. And then the unidirectional movement of both lines followed again (item 4), recommending that we re-enter the market with sales and keep them until the SSA changes its direction.Read more: 15 forex trading signals for beginners that you need to knowSignals of interaction of the price chart and cloud linesAs we already know from the definitions, the SSA and SSB lines act as support and resistance levels of the market. Based on this, strategies for working in the market are built on the breakdown or rebound of the price chart from these lines. Important components of this strategy are the factors of the mutual position of the chart and the cloud, as well as the color of the cloud standing in the way of the price chart. Let's look at these points with examples.Picture 6. Operation of the cloud.Picture 6 clearly shows how the cloud and its components work when interacting with the price chart. If the price approaches a bearish cloud from below, then SSA stands in its way (in this case, it acts as the lower boundary of the cloud and resistance). The breakdown of this line will allow the price to enter the cloud, where, as we described above, interests will meet with the opposing side. And the bulls' goal will be the opposite side of the cloud, where SSB will already act as resistance, and SSA will already act as support for them in this confrontation. Entering the cloud usually indicates a high probability of flat movement. This will be confirmed by the lines of the cloud that will be drawn at this time.Realizing that a breakdown of the SSB will put an end to the long-term trend, bears will resist at this border of the cloud. Especially since this is their cloud. And usually, when this line is reached, there is a rebound from it, and the price rushes back to the lower border of the SSA cloud. Such maneuvers can last as long as you want. If, during the reverse course to the SSA, this line turns out to be broken down, then we will most likely get a continuation of the bearish trend, the rebound will give the bulls new strength, and the price will again rush to the upper border of the cloud. A breakdown of the SSB will mean the price entering the growth zone, the victory of the bulls and the final trend change.The same thing happens with other variants of the price chart and the cloud. Only the options change, which line is the first on the way to the price chart.Thus, we have several more signals from the Ichimoku indicator.Breakdown of the upper boundary of the cloud up – a buy signal;Breakdown of the lower boundary of the cloud down – a sell signal;A rebound from the lower border of the cloud from below is a signal to continue the trend and sell;A rebound from the upper border of the cloud from above is a signal to continue the trend and buy.Read more: Forex Signals - what is it? How to use them?Working inside the Ichimoku Cloud (flat)Breakdown of the cloud boundary and entry into the cloud – a buy or sell signal with the goal – another cloud boundary.A rebound from the cloud boundaries is a buy or sell signal with a goal – another cloud boundary.When working with the price and cloud chart, as we said above, the moment of the thickness of this cloud and the angle of contact between the price and the SSB is important. The thinner the cloud, the more likely it is to break through. The sharper the angle between the price chart and the SSA or SSB, the less chance this line has to resist a breakdown.Here is briefly what I wanted to convey to you in this lesson.
  To assess the current state of the economy and future trends, investors use various tools: GDP dynamics, stock indexes, unemployment, inflation, PMI business activity index, producer inflation, consumer expectations indicator, etc. But in addition to stock indexes, you can also analyze the value of the national currency of the United States - the dollar.Since the stock market is an integral part of the economy, as integral as the dollar in the economy, the dynamics of the value of the national currency can serve as signals potentially important for the investor. The dollar is the main currency of international settlements, the main world reserve currency, the main volume of debt obligations in the world is issued in US dollars. Therefore, the value of the dollar is a kind of barometer not only of the US economy, but also of the world economy. The dollar has its own index - the DXY dollar index (DXY or USDX tickers).In this article, we will look at what the US dollar index DXY is, how it is calculated and how to interpret the dynamics of its value.What does the US dollar index DXY meanThe US dollar Index (DXY) is a calculated indicator of the market value of the US dollar relative to the "basket" of monetary units of the countries - the most important trading partners of the United States. The index basket consists of 6 currencies: euro, Japanese yen, British pound sterling, Canadian dollar, Swedish krona and Swiss franc.We can say that indirectly, the index value characterizes the dynamics of US exports, because with its growth, the demand for the dollar also increases.To calculate the index, currencies are assigned different weights in accordance with the shares of currencies in US international trade:At the time of the index's creation, to a greater extent, it was they who held the primacy in the foreign trade turnover of the United States. More than half of the weight (57.6%) has the euro, and the share of the smallest component – the Swiss franc - is 3.6%. Based on the weight of each currency pair, it can be concluded that the role of the euro in the formation of the dollar index is several times higher than that of other currencies.The DXY index is calculated using the weighted average geometric calculation method. Each national currency of the US partners from the currency basket of the index has its share of influence on the USDX index. The formula has the following form:The index value reflects the change in the ratio of the dollar to other currencies compared to its base value. The coefficient 50.14348112, which is involved in the calculation formula as the first term, was selected in such a way that the initial value of the index was 100 p. The power coefficients are equal to the shares of the corresponding currencies in the index base.The growth of the index indicates an increase in the value of the dollar compared to the "basket" of currencies, i.e. its strengthening, and vice versa, its decline indicates that it has become weaker. If the index value is greater than 100, then the strength of the dollar has increased by the corresponding amount. And, conversely, when the dollar price decreases, the index decreases.History of the US dollar index DXYThe calculation of the dollar index began in 1973 after the termination of the Breton Woods Agreement. In accordance with this agreement, for a long time, the currencies of 44 countries were pegged to the dollar, which, in turn, was backed by gold ($35 per troy ounce (gold standard).In 1973, the United States refused to link to gold, because its reserves in the United States were limited to a certain amount, and the dollars secured by gold were not enough for the development of world trade. Since then, countries have switched to floating exchange rates of national currencies.In the same 1973, the DXY index was created as a barometer evaluating the "paper" dollar in relation to other currencies. Initially, the basic basket of the index included 10 currencies, of which 8 were European. The base of the index has changed only once – in 1999 in connection with the formation of the eurozone and the emergence of the euro. The euro replaced 5 currencies of European countries from the index. Until 1999, the most significant currency for calculating the USDX index was the national currency of Germany – the German mark.The initial value of the index was taken as 100 p. The following index calculation results are measured as a ratio to the base value.Initially, the US dollar index was developed by the US Federal Reserve System in 1973 to obtain the average value of the US dollar weighted by foreign bilateral trade, freely floating against world currencies. Now the index is calculated by the ICE exchange holding (Intercontinental Exchange, Inc.). The calculation is made daily, once an hour. There are no regular adjustments or rebalancing of the ICE US dollar index.The values and dynamics of the dollar index may be different, but the following values are taken as benchmarks.More than 100 pp. – similar values indicate the strength of the dollar relative to other national currencies from the index basket.Equal to 100 p.p. – this means that the dollar is at the level of the other currencies of the index basket.Less than 100 pp. – this indicates the weakness of the US national currency.As can be seen on the graph, the maximum index value (160 pp.) was fixed in 1985, the minimum (72 pp.) - during the 2008 crisis. At the time of publication of the article (10.08.2022), the index value is 106.303 pp. This means that the value of the dollar has increased by 6,303 p.p. compared to the baseline value. This is the highest value in the last 20 years.Thus, the DXY index measures how the dollar price changes on the world market.What does the dynamics of the dollar index DXY indicateThe specificity of the DXY dollar index is that its dynamics cannot be interpreted unambiguously. Unlike conventional currencies, which fall when the country's economy deteriorates, the US dollar can strengthen both during economic growth in the US and during a global recession or economic downturn. This feature is due to the fact that the dollar is the world's reserve currency and plays a unique global role in the global economy. On the one hand, investors see the American currency as an opportunity to make money on the economic recovery, on the other hand, they consider the dollar as a relatively safe asset that will allow them to survive difficulties while saving their savings. This feature is called the "dollar smile theory". There are 3 phases in the behavior of the dollar:Phase 1 – Dollar growth due to increased risk aversion. The dollar is strengthening with a decrease in the growth rate of the global economy and an increase in risks in the markets. In such a situation, in order to avoid possible losses or minimize them, investors exit risky assets and direct funds to the dollar, which is considered a "safe haven currency". At this stage, the investor's goal is to preserve, not increase, the available capital. In addition, to invest in US Treasury bonds that are considered risk-free in any economic situation, dollars are also needed, which leads to increased demand for them and an increase in the exchange rate.Phase 2 - Economic recession and recession. At this stage, the economy is showing signs of slowing down or even recession, and the Fed is starting to cut interest rates. Investors are starting not to buy, but to sell the dollar in order to switch to currencies that can provide higher returns. Demand for the dollar is weak, which leads to its fall.Another factor is the relative economic efficiency of the United States and other countries. The US economy may not necessarily be stagnant, but if its economic growth is weaker than in other countries, then investors will prefer to sell US dollars and buy the currency of a country with a stronger economy. As a result, the lower part of the "smile" is formed - the dollar is falling.Phase 3 – Economic growth. The values of fundamental indicators are beginning to indicate an improvement in the economic situation, i.e. the phase of economic growth. Companies are increasing production, there are signs of economic recovery. Investors' risk appetite is returning. Thus, with stronger GDP growth in the US economy compared to other countries, the dollar is also strengthening. Thus, the key factor in the dynamics of the dollar index is relative economic growth. If the economy of the "rest of the world" can grow faster than the US economy, this will lead to a weakening of the US dollar. If the US economy is growing faster, then the US dollar will grow. In fact, the influx of foreign money into American enterprises and investments leads to an increase in the value of the dollar.An example of such a scenario is the 2008 crisis. In mid-2008, investors sought stability during the crisis period in the form of investing in the dollar, which led to its strengthening. As the situation normalized and the crisis processes slowed down, the focus of investors' interests began to shift to more profitable and risky instruments. This flow of capital led to a significant drop in the US dollar in early 2009. The recovery of the US economy from the crisis caused an increase in demand for the dollar and, as a result, its strengthening until the end of the 1st half of 2010.The factor of updating the highs of the dollar value relative to world currencies from the reserve basket in 2022: the Fed started tightening monetary policy earlier than other major central banks (against which the yield of government treasury bonds began to rise), the problems of the eurozone, the devaluation trend in the euro and yen, the weakness of stock markets. All this together makes American investments more profitable, because now they promise higher profits. Finally, investors and analysts are concerned about the global recession – the dollar is traditionally considered the most reliable asset in turbulent times.Let's take a closer look at how the change in the dollar index affects the dynamics of some investment instruments and the economy of enterprises.BondsThe increase in the profitability of investments in US Treasury bonds is accompanied by an increase in the DXY index. Bonds are traditionally considered the lowest-risk assets that allow you to save capital. At the same time, in order for them to be attractive for investment, their profitability should be higher than the inflation rate.Currently, due to an increase in the interest rate and an increase in bond yields, investors are starting to exit riskier assets of other countries, i.e. there is a flow of funds into the dollar for further investments in bonds. In addition, due to the unstable global economic and geopolitical situation, the demand for the most risk-free instruments is growing. This leads to a strengthening of the dollar.StocksA stronger dollar is not always good for equity investors. It means:A decrease in the profits of exporting companies and global corporations from sales of products in other countries.An increase in the costs of exporters, which leads to an increase in prices for the goods they produce and, as a result, a decrease in competitive advantage.Increasing the costs of foreign companies operating in the United States.Thus, the growth of the DXY index signals a weakening of the US stock market, i.e. the dollar index is basically moving opposite to the S&P 500 index.Such a decline in the market is due to the fact that a strong dollar makes imports cheaper and exports more expensive and less competitive in world markets. The rising dollar affects the profits of many global corporations.Exporting companies and global corporationsCompanies that supply their products around the world make more profit with a weak dollar.The high values of the DXY index, i.e. the growth in the value of the dollar negatively affects US exports. In this case, the volume of goods purchased by other countries decreases, because they need more of their own currency to buy the same volume. That is, US companies face the following consequences of the strengthening of the dollar:Decrease in the volume of exports.Margin reduction, as a result of a decrease in the volume of funds received, including for the development of the company. In this case, there is a significant adverse effect of exchange rate fluctuations.The weakening of the exchange rate of a foreign currency against the US dollar adversely affects the company's sales and revenues denominated in a foreign currency (other than the dollar), and usually leads to the company raising prices in other currencies to compensate for the strengthening of the US dollar, potentially reducing demand for its products. If in some cases, for some reason, the company decides not to raise prices, this negatively affects the profit that the company earns in US dollars: when converting foreign exchange earnings into US dollars, the company receives less (since the dollar has become more expensive).Importing companiesA strong dollar benefits US importers. With the growth of the dollar, imports for American companies become cheaper, and they can make more profit. For companies in other countries that import products from the United States – on the contrary, because they have to spend more of their currency to buy goods or raw materials.Commodity marketsPricing for most commodities occurs in the US dollar due to its role as the leading reserve currency. Local production costs and consumer prices can be expressed in different currencies, but for wholesale deliveries, the US dollar is used as a means of exchange. Over time, the growth of the dollar usually leads to a decrease in commodity prices, while the weakness of the reserve currency is a factor in the growth of prices in commodity markets. An increase in the DXY index leads to a decline in all commodity markets.Below is a graph of oil prices and the DXY index, which shows the inverse correlation of the dollar index with oil prices.In addition to the impact of the dollar's value on financial and commodity markets, it is worth mentioning separately the following global consequences for the economies of other countries:An increase in the debt burden on the budgets of countries that have dollar loans. After all, it is a well-known fact that the bulk of the world's debt obligations are denominated in US dollars. US banks actively lend not only to companies and businesses, but also to entire states. With the growth of the dollar, borrowers have to pay more on their debts.Emigration of capital from countries. When the national currency (other than the dollar) weakens, it forces large businesses and investors to withdraw funds from the economy of this country, which is an additional factor in the weakening of the local currency.Negative impact on economic growth. The effect of the dollar's growth is felt by importing companies, manufacturers who are heavily dependent on imported components from the United States. In the conditions of modern global globalization, it is difficult to find production facilities that are 100% provided by local markets. This is especially true for the production of complex technological products. To maintain output volumes at the same level, manufacturers need to spend more money on purchases, which often leads to losses. Therefore, a compromise option is to reduce the volume of output. On the scale of the country's economy, this means a drop in GDP.Pros and cons of the DXY Dollar IndexLike any other indicator, the US dollar index has its pros and cons:AdvantagesExtensive use of the index. The index is calculated around the clock.Availability of futures and options on the index. Index futures can act as a leading indicator of the movement of currency pairs. For example, if a bearish candle appears on his chart, it may mean that a surge will occur on the currency charts.Allows you to analyze the value of the dollar with more objectivity than the dynamics of a single currency pair.DisadvantagesA small number of currencies in the index, as well as a large proportion of the euro, which, when it fluctuates, leads to significant distortions and inadequate index values.It has stable power coefficients that do not correspond to the current modern structure of the US foreign trade turnover. The weights were last changed in 1999 after the introduction of the euro and have remained unchanged since then. However, much has changed in trade relations with the United States. For example, China, South Korea and Mexico have become key trading partners of the United States. The diagram below shows the structure of US foreign trade turnover in 2021:For a more adequate reflection of the US trade balance with other countries, the Fed calculates the Trade-weighted Dollar Index (TWDI). The basket of this index includes 26 currencies. Currency weights are recalculated annually. However, despite such a large number of currencies compared to the DXY index, the dynamics of the indices are almost the same due to the fact that the euro also has a lot of weight in TWDI.ConclusionThe US dollar index is a synthetic instrument reflecting the current dynamics of the price of the US currency. The index shows the strength or weakness of the US dollar more objectively than in relation to any one currency. This tool is used in their work by traders, investors, stock analysts. It gives a correct assessment of currency market trends and all assets in dollars. The global economic situation largely depends on the state of the American economy. The strength of the dollar can be considered as a temperature indicator not only of the US economy, but also of the global economy.The dynamics of the index indicates certain trends in the economy, but it is impossible to assess the current situation and trend by only one indicator. Moreover, the specificity of the index lies in the fact that the dynamics may indicate completely opposite trends – the dollar index shows its growth both during economic growth and during recessions. Therefore, the index can act as one of the tools in the investor's arsenal, but it is always necessary to conduct a comprehensive analysis of a number of macroeconomic indicators.
  One of the most popular methods of analyzing stock instruments is graphical technical analysis. Technical analysis is one of the main methods of analyzing and forecasting future asset prices.In this article we will consider the basic aspects of technical analysis: what it is, how it differs from fundamental analysis, the main tools and examples of their practical application.Technical and fundamental analysisTechnical analysis is a set of methods that allow you to analyze the chart and make a decision on buying/selling a particular instrument in the securities markets. Or, more simply, these are various ways of analyzing quotation charts in order to predict future price behavior.If fundamental analysis answers the question "which stocks or currency pair to buy?", then technical analysis shows at what point in time to buy.The fundamentalist is trying to understand the reason for the market movement, and the "tech guy" is interested in the very fact of this movement. All that a technician needs to know is that such market dynamics simply exist, and what exactly caused such a movement is not particularly important.The task of fundamental analysis is to help an investor buy a stake in a quality business. The task of technical analysis is to help the investor enter into a transaction at the best price. Or, in other words, to determine the optimal entry point.Trade directionsLong. When an investor waits for the growth of the paper, he buys them. In professional language, "longs", trades "long", long stocks / futures / etc., a long position, i.e. earns on the growth of value. In a simple way, bought cheaper, sold more expensive.Short. If a trader is waiting for the price to decrease, he sells them, in professional language "shorts", trades short, short position. Earns money by reducing the cost of the instrument.How can you sell something that was not in the portfolio?You borrow securities from a broker and sell them at the current high price. Then, when they become cheaper, the securities are bought back and given to the broker, and the difference between the "high" and "low" price is yours.Features of shorts. The broker lends the securities at a percentage. That is, if you pay only the commission for the transaction in the long, then in the short you also pay% for the debt. This should be borne in mind when calculating the profitability of the strategy and when entering a deal. The amount of the percentage must be specified with the broker. Usually, during intraday trading (when you short during the day and close the deal during the day), % is not taken, it is taken to transfer the position through the night.We wrote in detail about the technology of opening short positions in our article "How to short stocks".Graphic trendsAll technical analysis is price forecasting based on the history of the price movement itself. The market can have only two states: trend and flat (horizontal, sideways).Chart analysis always begins with determining the trend on the instrument. The trend is drawn on the older time frames so that there is an understanding of the global trend – in which direction it is necessary to look for inputs.The trend in a growing market is a consistent increase in the highs and lows on the chart.The trend in a falling market is a consistent decrease in the highs and lows on the chart.Trend rules. The trend will continue its movement rather than change direction. The task of the investor/trader is to trade according to the trend and join it at a comfortable entry point.A trend breakdown most often means a possible reversal or consolidation in the market. If the trend is strong, then we see on the chart that each previous pullback is higher (lower) than the previous one.Rules for building graphical modelsOn the uptrend chart, the trend is based on the minimums of candles/bars.On a downtrend, we build the trend on the highs of candles/ bars. For example, the global bearish trend since 2013 on the weekly chartHow to work on trends. The investor expects an entry on the test (touch) of the price of the trend line, that is, when the price has reached the line as much as possible and has strayed, it is possible to enter the transaction.Support and resistance levelsThe price chart always moves in waves. On the bases and peaks of the waves, we can see the levels at which the price turned around, or continued its movement after a long sideways movement.The support level is the border where the price turns up. It does not allow the price to fall lower.The resistance level is the boundary where the price turns down. It does not allow the price to go higher.Read more: The basis of trading: Support and Resistance levelsLevel RulesThe support line can become a resistance line and vice versa.The more often the price hits the level, the stronger it is.It's always a range, not a clear line.Mirror level.One of the strongest levels is considered to be the mirror level.Mirror levelIt can be seen on various instruments and time intervals.How to trade by levels:A risky option is to enter the breakdown level (marked with a blue arrow).Moderate - entering a position after the level test (marked with a red arrow).Stop loss - is set for the level / the nearest minimum / the mathematical risk/profit ratio is calculated.Price channelsA price channel is a limited trading range in which the price moves for a certain time. The boundaries of the trading channel are limited by two lines: support and resistance.Read more: What is Technical Analysis and why does an investor need itLike levels, price channels can be ascending, descending, and sideways depending on the phase in the market.How to build a price channel on a chart?For an ascending trading channel, it is necessary to determine the beginning of a trend movement and draw a trend line (the main channel line) along the first two lowest minimums (reference points). Then, parallel to it, project another trend line to the upper point located between them.How to trade?Most often, trading is conducted inside the channel: when testing the channel boundary – the entrance, the target is the opposite channel boundary, the stop loss is placed outside the channel boundary based on the risk guidelines of each individual trader.ConclusionTrading on the stock market is based on the same principles for everyone. But everyone's trading strategies are different - simply because investors' goals and risk profiles are different. The investor selects the most suitable strategy for him and by the level of risk, and by time frames, and by the system.The combination of fundamental and technical analysis in trading gives an excellent result. Complementary methods allow the investor to justify the transaction based on fundamental indicators, and the use of knowledge and technical analysis tools allows you to enter into a transaction on an optimal risk/profit combination.Read more: Technical analysis on the forex market
  Many investors are familiar with the negative attitude of people towards investments. It is especially difficult for beginners – their relatives and friends begin to dissuade and tell scary stories of those who were deceived and lost all their savings on investments. Stories also periodically appear in the media about how an employee of some broker or bank ran away with clients' money, how the promised mountains of gold turned into black holes of capital losses.Is everything really so scary in the investment market, who is to blame for all this and how to protect yourself from fraud on the stock exchange?Who is a brokerA broker is a professional bidder. He is an intermediary between the exchange and the investor. Not all bidders can trade directly on the exchange, there are certain restrictions for this. Organizations that do not have direct access to trading on the exchange, as well as individual investors, can only trade on the exchange through an intermediary broker. The broker registers the client on the exchange, organizes the client's technical access to trading, withholds taxes in accordance with the legislation. For its activities, the broker charges clients a commission, which depends on the chosen tariff and the operations that the investor performs on his account. A bank or an investment company with a special license can act as a broker.Thus, in his investment activity, the investor contacts directly with the broker. Therefore, choosing a broker is very important. The client's capabilities also depend on the broker: available exchanges and a set of tools, the threshold amount of investment, costs and quality of service. Well, if something goes wrong, it is logical to assume that who is to blame? - broker!Broker's deception or investor's mistake?So how can a broker cheat? Next, let's look at the main traps that an investor can fall into and which can cause the loss of a significant part or even all of the funds. We will immediately warn you that there will be no loud revelations. Not all the troubles and losses in investments are deception of the broker. An investor can sometimes make mistakes himself, be led by fabulous promises, make rash decisions."He who is warned is armed" - it is important for an investor to know about all the nuances, since mistakes in investing can cost too much.Forex brokersMost often, well-known fraud schemes are associated with the Forex market. In general, Forex is an over-the-counter interbank foreign exchange market. That is, in principle, individuals cannot be participants in this market. However, there are a huge number of offers on the Internet to make money on Forex / Forex / FX, and so on. At the same time, such earnings are positioned as investments, trading, and organizers as brokers. However, such activities have nothing to do with investments. This is the market of derivative financial instruments - essentially a casino where bets are placed on changes in the exchange rate of a currency pair. And in the casino, as you know, the casino wins. No one brings these individuals to any foreign exchange market, and we are not talking about real currency trading. And, despite the fact that an article about Forex dealers appeared in the law "On the Securities Market" (they are dealers, not brokers), and the Regulator even issued licenses to several Forex dealers, this market has not become safe. The number of scammers is large, and the number of people who want to get rich here and now is no less. Clients are offered training. You can start trading with small amounts that allow you to win first. Appetites are growing, and so is leverage. Unlike a deposit and traditional investments in the stock market, such games really usually end with a loss of funds. If the client still wins, there may be problems with the withdrawal of funds, under various pretexts: for example, to additionally replenish the account to withdraw income, or to wait for some time. And they can withdraw funds in an unknown direction with the help of frankly fraudulent actions. The fantasies of scammers are limitless.Thus, real brokers have nothing to do with it, and forex games have nothing to do with real investments.Read more: Forex broker: how to choose a good brokerScam brokersThe securities market has its own schemes of deception, but they are all based on the same desire of the client to get rich quickly and easily, which scammers use with might and main. Customers are persistently lured by tens and hundreds of percent of profits, "super promotions", bonuses, cashbacks, exceptional offers, put pressure on the need to make decisions quickly, without giving time to think. An experienced investor will not be led to such offers, and an inexperienced one will be offered a consultant or mentor who will accompany his transactions. While the deposit is small, customers make a profit, and are more willing to invest more money. The "broker" is very attentive and usually aware of the financial situation of his client. Further, the options for the development of events may be different, depending on the credulity of the client and the imagination of scammers. For example, a consultant may inform you that a great deal is planned, offer to make a bigger deposit in order to break a big jackpot. And if the client no longer has his own money, he will offer a loan. Trusting clients allow the broker's employees to make transactions on their behalf without instructions from the client himself, issue a power of attorney to perform transactions on the brokerage account, provide access to the account (login, password). This is how deceived investors appear, whose assets are "merged" by a broker, or disappeared together with a personal manager. In this case, yes, the broker is a fraud, the only question is, was there a broker (a real, licensed bidder), and who and why gave him a power of attorney, provided direct access to the account?Each broker may well have its own trading platform, and this is normal. However, not all platforms are certified. Fraudulent brokers can install special programs on them that ensure price slippage, delay execution of orders, limit the client's profitability when trading derivatives, fake price charts, and other tricks that are not always noticeable to the client, but are very reflected in the state of his account. These schemes relate more to trading, rather than long-term investment, but you need to know about them in order to understand how important it is to choose the right broker.Chargeback - challenging the transaction. When the client realized that he was deceived, he can try to return the money from the false broker by contacting his bank. This complicated procedure exists, but no one will give guarantees, and it will most likely not work to return the money. The recipient and the broker may be completely different persons, the recipient may have disappeared altogether, or the client transferred money to an individual on the card, or the client does not have enough documentary evidence, and the bank is not eager to bother, some employees may not even know about the possibility of such a procedure. However, there are companies that offer money-back services from "black" brokers. If they promise a 100% guarantee and require prepayment, it is likely that the client will fall for the bait of scammers a second time.Read more: Stock market Broker: how to choose it and how to work with itClone sitesClone sites that completely duplicate the interface of the original site. The difference may be in just one sign in the address bar. The site may contain all the necessary information and documentation - information about the organization and license, only fake. Such sites belong to scammers, and the money transferred using such sites, the details specified there, will go to the scammers, and not to the client's brokerage account.Overnight on the broker accountOvernight is a loan of securities that the broker, with the consent of the client, takes from his brokerage account for his short-term transactions between trading sessions at night or on weekends and undertakes to return before the start of the trading session. Remuneration is paid to the client for overnight transactions. At the same time, the client himself allows the broker to perform such operations with his securities, sometimes without even suspecting it. This item can be included by default in the brokerage agreement. Of course, this cannot be called fraud, unless this clause of the contract is deliberately hidden from the client. But this is an additional risk for the investor. After all, in the event of a sharp jump in the prices of borrowed assets, a situation may arise when the broker will not be able to redeem and return the securities to the client. And as you know, assets on brokerage accounts are not insured. Therefore, in this case, it is up to the client to decide whether to allow the broker to make overnight transactions.Increased broker feesBrokers charge clients a commission for their services, as well as for the services of the depository. The commission amount differs from broker to broker and depends on the selected tariff. The rates may differ significantly from each other and are targeted at different categories of customers. Someone performs ten operations per quarter or per year, and someone per hour. Someone needs access to foreign exchanges, someone does not. Someone is just starting his way as an investor and forms capital with small amounts, while someone is already operating with very significant amounts. The broker can also provide a personal consultant, trader or additional analytics. Obviously, the rates for different customers will differ. Imagine that a client with a small capital chose the tariff with the lowest transaction fee, but at the same time did not pay attention to the presence of a subscription fee on such a tariff. As a result, even if there are no transactions on the brokerage account, it will incur exorbitant maintenance costs. Or an active trader client will choose a tariff without a subscription fee, but with a commission for transactions, as for investors who make few transactions. Its maintenance costs will also be overstated.Read more: What is OvernightTwin tickersThere are companies with similar tickers on the stock exchange and there are cases when investors, either afraid of missing the moment and falling behind the trend, or simply out of ignorance or inattention, bought shares of another little-known company with a similar ticker instead of the shares of the desired company, accelerating the value of the latter to an incredible size. On the one hand, the situation is curious, but it can also become seriously unpleasant, depending on the size of the transaction and the consequences. Here are some examples:APLE and AAPL: real estate investment fund REIT (Apple Hospitality Reit) and the well-known "apple" (APPLE). As a result of confusion, you can become the owner of such different assets:ZOOM and ZM: In April 2020, investors mixed up the tickers and instead of shares of ZOOM VIDEO COMMUNICATIONS (ZM - developer of video conferencing service) bought shares of ZOOM TECHNOLOGIES (ZOOM is a supplier of wireless communication equipment, currently ticker ZTNO), as a result of which the price of the latter soared by almost 800%, but not for long.TLSA and TSLA: These twin tickers also represent very different companies. The well-known technology giant TESLA and the company from the biotechnology industry Tiziana Life Sciences.In this case, of course, there is no deception, this is the mistake of the investor himself. Such a mistake can end up being expensive. Therefore, when applying for the purchase of an asset, the investor should be very careful.Read more: Practical advices on choosing a Forex broker for a beginnerMargin tradingMargin transactions are transactions with leverage, on borrowed funds provided by the broker. If successful, such transactions can bring multiple profits. However, you need to understand that if an investor makes a mistake in his calculations and strategy, then losses can reset the investor's capital. Therefore, before entering into such transactions, you should evaluate your capabilities, strategy and risks well. As Warren Buffett said, "If you combine ignorance and credit, you will get very interesting results," and it is unlikely that he meant fabulous profits. If the possibility of margin lending is not disabled in the settings of the trading program, the investor may accidentally open such a deal without even knowing about it. And this, too, is no longer a broker's fraud, but an investor's own mistake. The broker offers opportunities, and it's up to the client to decide whether to take advantage of such opportunities or not.Trading robotsTechnology is our everything. The robot is an automated trading program that connects to the interface of the broker's application or terminal and, according to a given algorithm, opens and closes transactions on the exchange, also analyzing the price movement of the instrument in accordance with the settings. Robots are more relevant for traders, not long-term investors. A trading robot is significantly faster than a human. Some robots can make up to 1000 trades per second. There is no fundamental analysis, emotions – only indicators, signals and an algorithm. The robot can trade 24/7 and monitor several instruments at the same time. This can greatly facilitate the trader's work, as well as his capital. Is the speed of trading and the number of applications so important?A trading robot can, of course, be used if a trader understands how it works, what settings and algorithms it has, regularly checks and adjusts it to the market. If not, then one day the algorithm can drain all the capital at its tremendous speed. Besides, if someone has created a robot that can make the owner rich in a short time, why would the developer sell it? After all, the more users of the robot, the less they earn. And which of the developers of trading robots is listed in the FORBES lists? And even if the developer really sold the robot with a profitable strategy that worked well in a certain market situation, the robot may not be adapted to another situation.Deciding whether or not to use a robot is also the prerogative of the investor himself, and if something goes wrong, there will be no one to blame.Read more: What are stock trading robots and how do they operateStock market manipulationManipulations on the stock market can be carried out with both stocks, derivatives, and cryptocurrencies. Individual market participants are accelerating asset quotes to sell them at the peak. Advertising, mailing lists, groups-communities of investors in social networks, including paid, fake news, insider information are in use. The object of manipulation is more often low-liquid assets of small capitalization, companies of the "last echelons" (2.3 levels of listing or unlisted list). There is usually little information on the financial condition of such companies. In the absence of market makers and regulators, lack of information, and given the low liquidity and value of the asset, it does not take a lot of money to pump up the price. Manipulation schemes are often based on trading features and traders' strategies. As a result, manipulators earn money, and those who chased the hype and the crowd suffer losses. Manipulation is really fraud, for which a large fine or a real term can be threatened in America. Manipulations also happen in every country, mainly with third-tier stocks. They often end with a warning and a fine, however, in the case of a particularly large size or an organized group, criminal liability and imprisonment may also occur. Brokers, their employees, and other market participants may be involved in manipulations.How can an investor protect himself from fraud and mistakes1. Careful selection of a broker.The broker must have a brokerage license. It must be posted on the broker's website. You can check the license on the regulator's website. There are many other useful lists and registries on the same site: forex dealers, exchanges, trading systems, depositories, securities issuers and others:2. Really evaluate advertising promises and offers.Investing is always a risk. And the greater the expected profit, the higher the risk. No need to believe fabulous promises to get rich quickly, not troublesome, with a 100% guarantee. There are no guarantees in investments. Aggressive promising advertising, intrusive calls and "burning" super-offers should be treated with caution.3. Do not follow links from advertising offers in social networks and messengers.Perhaps the link will lead to a fraudulent site. It would not be superfluous to check whether the connection on the site is protected: the image of the lock at the beginning of the address bar.4. If you fall for the bait of scammers, you can contact the competent authorities about fraud, and your bank about the possibility of a chargeback. The probability of a refund is low, but there is a chance, and a considerable one, to fall into the trap of scammers for the second time, trying to carry out a chargeback with the help of intermediaries (perhaps the same ones who cheated the first time, but have already "retrained").5. Select the tariff deliberately in accordance with your portfolio and strategy.6. Disable overnight in the broker's application settings, for greater reliability, especially in a volatile crisis market.7. Disable the ability to make margin trades if the investor does not have sufficient knowledge and experience for margin trading. Everything can also be done in the broker's application or in the investor's personal account on the website.8. Carefully weigh whether it is worth using robot programs for trading and auto-research for investment. It may be much more effective for an investor to be trained to understand how to build and manage their investment portfolio. It is worth recalling Warren Buffett's quote again: "The risk comes from not knowing what you are doing."9. Carefully evaluate the asset before buying. What is the idea in this asset, what is its value and source of profit, does it correspond to the investor's strategy, is the price for the offered value adequate? Fundamental analysis will avoid manipulating asset prices and buying a dummy at a fabulous price. Also, preference should be given to highly liquid assets with large capitalization, which are difficult and expensive to manipulate.10. Invest in long-term debt. Traders are more susceptible to fraudulent manipulations, as they trade on news and price fluctuations. Technical analysis, signals, indicators, and often margin lending are the main tools of traders. And this is always a much greater risk than a reasonable investment in long-term investments based on fundamental analysis and diversification.11. Be a reasonable and cautious investor. Listen to official sources of information and make important decisions on your own, relying on your own knowledge, calculations and analysis. Do not follow other people's advice without passing them through the prism of your strategy. Do not give in to panic and hype. Do not forget that where there is money and the desire of people to get rich, there will definitely be scammers. Well, the most elementary thing: do not tell anyone your usernames / passwords. Law enforcement agencies and mass media regularly warn about possible fraudulent actions.Read more: What is Slippage in trading?ConclusionYou should not be afraid of cheating a broker if he meets the selection criteria: he has a license, a large number of active clients, large trading turnover, a certified trading platform, a convenient application, a tariff policy and a set of tools suitable for the investor, access to the trading platforms necessary for the investor, good customer service. You should be more afraid of your own rash actions, unjustified risk, lack of knowledge.As W. Buffett said, "The most important investment you can make is to invest in yourself." This is the safest investment and the most profitable. It is knowledge that will allow you to protect yourself from fraudsters and your own mistakes and self-deception.Learning is not scary, not difficult and cheaper than losing capital on scammers and your own mistakes. You can start with free information, which in our age of information technology has become more accessible to everyone than ever. However, it is worth filtering the information and checking its sources. You should trust only those who have achieved success themselves, invest their own funds, and were able to save and increase capital not only during periods when everything is growing in the market, but also during periods of corrections and crises.
 .png) In 2022, there is a lot of talk about the crisis and recession. Everyone feels that something is wrong in the economy - the costs of habitual purchases have increased and, perhaps, what they have been saving for for a long time has become significantly more expensive. In addition, many economically active people are also private investors. Moreover, a significant increase in the number of investors occurred in the last 2 years, when deposit rates were not pleasing, and investments in the stock market showed impressive results. After the growth of stock markets in the post-crisis period, 2022 has become a real test for investors. First of all, for beginners who have just joined the ranks of investors. Pros could also face certain emotional difficulties.The stock market and the quotations of individual stocks can not only rise, but also fall. This is an axiom. Sometimes the drop can amount to tens or even hundreds of percent. Often investors do not understand what to do when quotes and the amount on the account "melts before our eyes". In this article, we, as practitioners whose investment portfolio has gone through a lot since 2015, but at the same time has shown and is showing decent results, will share our experience. We will tell you what is worth and what is not worth doing during the fall of the markets. Perhaps for someone these tips and recommendations will become a soothing pill when the first panic attacks appear.Calm, only calm!It is important to maintain psychological calm in a crisis, and it is doubly important for an investor – this will help avoid impulsive actions in the market, which you may regret later. There are a few simple rules that a reasonable investor should definitely not doDo not cook in the flow of negative newsIn the modern world, for most of us, the main source of news is the Internet. One has only to click on the title on a certain topic once, the search engine will immediately helpfully fill up the feed with such news. The most "clickable" news is negative, so it is not surprising that the reader of the news feed turns out to be an unwitting prisoner of the flow of negative information. The same principle works for the media – of all the events, journalists are more likely to talk about tragic ones or thicken the colors by placing the right accents. What can we say about the Internet or the philistine media, if even professional publications "sin" like this? You can even conduct an experiment by entering the query "crisis", "recession", "market collapse" and so on in the search engine. It turns out that everything will happen literally tomorrow, and you are not ready yet.It is important to understand that the objective picture of the world is often different from the one that is formed from the news. In addition, there are always more negative messages in a crisis, periods of falling markets, and due to the peculiarities of modern media, they usually fill the news feed. Do not read the news too often - it can cause constant background stress. Therefore, one of the important psychological qualities of an investor is to be able to emotionally distance himself from bad news and remain calm. It is a calm and balanced state that will help you not lose your way and follow the chosen investment strategy.Of course, it is impossible not to be interested in what is happening at all. Moreover, in the modern information world, important information obtained from reliable sources can help you make the right decision in time. Therefore, it is important to set up your sources of information in such a way as to weed out the unnecessary and not miss a really important event in the stream of momentary sensations.Do not look every hour at the changes in quotations, remember about long-term investmentOf course, an evergreen portfolio is fine. However, stocks cannot always show growth – their peculiarity is that they never grow in a straight line, although in the long term the market is always growing. The investor should be prepared for the fact that some stocks in the portfolio are growing, some are falling. In a crisis, all stocks can fall. But the stock market, like the economy, is cyclical: a crisis always gives way to a boom, and a period of growth is followed by a recession. If we choose fundamentally reliable assets in the portfolio and are confident in our choice, the momentary market conditions cannot plunge us into panic.If we look at the dynamics of the market over the past 30 years, we will see that there have been both corrections and collapses in history. The reasons and the depth of the fall were different, but what was the same was that any market decline ends, and recovery follows.Read more: Recession in the US in 2022Don't be afraid and don't panicThe stock market and the economy as a whole are developing cyclically. Periods of boom and recession have followed each other throughout the history of mankind. Of course, a lot of things collapse in a crisis, and even stable, well-developing companies may experience difficulties. However, you should not succumb to the influence of the crowd and panic, even if everyone around is just talking about the crisis. You will say it is very difficult. Indeed, it is not easy to resist when, for example, all stocks fall by 20 or 30 percent. The only thing that can be contrasted with emotions is reason. When a person reasons logically, emotions recede into the background.The Council. It is important to maintain the ability to reasonably assess what is happening. Knowledge of the basics of investing and financial literacy and the ability to apply them in practice will help to preserve the accumulated capital.Be critical of investment adviceWhat is most interesting, both experts and people who are far from investing can give advice. A separate category in the advice section is bloggers' advice. Currently, bloggers write and shoot videos about everything that subscribers read and watch, not counting explicit advertising. Investments are popular. Please, there are plenty of gurus on the Internet who give out content about investments every day. There are two main trends in the information flow of bloggers, which are better treated critically, especially in a crisis:1. It is profitable to invest - not for an ordinary person.Bloggers often write that only large investors can make good money on insiders and gray schemes at the expense of inexperienced "hamsters". What is the interest of such an author, it is clear – articles and videos with revelations always collect more views. And a novice investor wants to avoid mistakes. Someone has already burned themselves on financial pyramids and similar scams and is starting to look for what the catch might be in investing. Especially a lot of such "sensational" materials appear in times of crisis – everyone is worried about the future, and in a crisis it is as vague as ever. Therefore, bloggers write about conspiracy theories, subscribers are disappointed in the possibilities of the stock market, merge existing assets at any price and leave the market.The Council. If you sometimes find yourself reading another revealing article about conspiracy theories in the stock market, it is better to devote this time to learning the basics of investing. This is the only reasonable way out – it is fundamental knowledge that provides a solid foundation and helps to gain confidence in their actions. It is important to choose professional training in the basics of the stock market, investments and financial literacy, because there are also a lot of training offers.Read more: How to participate in an IPO2. The second topic frequently encountered by bloggers is tips on which securities to invest in.Such materials also collect a lot of views. Consulting an independent financial analyst is expensive, and bloggers give out advice for free – and the investor shifts responsibility for the final decision from his shoulders to the blogger. This is a common psychological trap of a novice investor: to look for someone who will confidently recommend what you can invest in profitably. Of course, bloggers argue their choice one way or another, without this, the recommendations would be completely unconvincing. In addition, it cannot be said that advice on the Internet is useless – perhaps there is a rational grain in them. But in order to separate really professional advice from populist statements for the sake of views and likes, it is necessary at least to understand the basics of investing. Today it is available to everyone. Moreover, investment literacy is currently a vital skill, as relevant as the ability to drive a car, for example. It is necessary to be clearly aware that only we ourselves are responsible for our investment decisions. The blogger got the right number of views – and has already earned. It does not matter to him whether those who used the voiced investment will eventually earn.The Council. It is necessary to develop at least a basic level of expertise in investments in order to be able to adequately perceive information flows from different sources. And of course, to minimize the flow of unprofessional information is not to read or watch bloggers who give out daily content for the spite of the day for the sake of views and likes.What not to do when markets fallAbove, we tried to understand what behavior in everyday life is best avoided by an investor in order to maintain calm and the ability to rationally treat a crisis situation. However, even if the above recommendations are followed, it is worth remembering that in no case should you do on the stock market in a crisis.Read more: How to make money in crisisDo not sell shares on emotionsWhen everything is falling, it may seem like a reasonable decision to save at least something and sell the shares right now. Objectively, this may mean fixing losses. Any investment decision should be balanced, and in a crisis – doubly so. It is important to conduct a fundamental analysis of the portfolio once again. If the company retains its potential and continues to develop even in a crisis, do not sell, but, if possible, average the position.Do not violate the rules of diversificationIn a crisis, even fundamentally attractive stocks can be very cheap. Investors are tempted to buy the paper they like for a large share in the portfolio. However, no one guarantees that the selected stock will recover or even increase in price, that the company will successfully cope with the crisis. In a period of uncertainty and high risks, it is more important than ever to diversify investments as much as possible so that the possible fall of one asset does not drag down the entire portfolio.We are talking more about stocks now - they attract everyone's attention in times of crisis. Of course, a balanced portfolio should also include bonds and, possibly, other financial instruments. You can read more about the diversification of the investment portfolio here.The same principle also applies to property as a whole: it is in a crisis that the temptation is great to shift capital into shares in the hope of profitably acquiring cheaper assets.Do not bring "last money" to the marketAll crises end sooner or later. However, this may not happen tomorrow or the day after tomorrow. In no case should you invest money in stocks that you may need in the near future, even if the price seems very attractive. Recovery after the crisis may take several years, and during this time the invested funds will be "frozen".Read more: Diversification of the investment portfolio: definition & methods of implementationDo not buy assets without fundamental analysisAs much as an inexperienced beginner wants to sell everything on a wave of panic, so much more sophisticated investor in a crisis wants to buy as many shares as possible at an attractive price. This is another extreme that can trap investors during a crisis. Of course, it is worth taking advantage of the opportunity to profitably acquire good assets, however, first of all it is necessary to adhere to the principles of reasonable investment. In times of crisis, fundamental analysis will help to protect against buying unreliable assets. It is important to analyze and understand whether the selected company will be able to survive the crisis, and only after that plan to buy shares.Do not expect that the market will grow tomorrowUncertainty at the moment is characteristic of the stock market as a whole – you can never predict for sure the further movement of quotations. In a crisis, the volatility of securities is even more unpredictable: when it seems that the bottom has been reached, the fall in stocks may continue (remember the well-known investor saying "To buy at the bottom - the second bottom as a gift"). Conversely, when an investor expects a further decline in prices, a market reversal may occur.Do not use margin dealsIn times of crisis, investors are tempted to bet on rapid growth or vice versa, on the continuation of the fall in quotations, and conduct transactions with leverage for a significant amount for the portfolio:borrow shares from a broker and sell them now (a "short" transaction) in the expectation that the price of the paper will fall further, and it will be possible to purchase it at a lower price and return it to the broker;borrow money from a broker and buy shares now (long or long position long sale) in the expectation that the price of the paper will rise, and it will be possible to get a positive difference after its sale.Leverage multiplies the result of the transaction - the investor can significantly increase profits or losses compared to the result that he could get from the transaction at his own expense. Of course, borrowed funds are provided by the broker at a certain percentage. Transactions with leverage are risky, they must be treated with the utmost care. Especially in a crisis, margin transactions can be a "disservice" to the investor. If the trend is guessed incorrectly, a large volume of margin transactions can lead to a margin call, that is, to the forced sale of assets by the broker to repay the debt on margin lending. The sale will be carried out at the market price at the time of sale, which may be unprofitable for the investor. Therefore, it is absolutely not necessary to use margin transactions in a crisis in the expectation that the market will grow or fall in the near future.Read more: Leverage on the stock marketConclusionIn this article, we have considered a few simple recommendations that will allow an investor to save capital in a crisis.To maintain emotional calm, you need:Do not cook in the flow of negative news.Do not look at the price changes every hour, remember about long-term investment.Be critical of investment advice.Don't be afraid and don't panic.There are also several principles of reasonable investment, which are especially relevant in a crisis:Do not sell shares on emotions.Do not violate the rules of diversification.Don't bring all the money to the market.Do not buy assets without fundamental analysis.Do not expect that the market will grow tomorrow.You can learn to be calm in a crisis situation, you can take financial literacy training and gain a certain level of expertise in investments. However, the stock market in a crisis is fraught with some temptations that can even encourage a relatively experienced investor to violate the basic principles of reasonable investment. Therefore, in order to preserve capital in turbulent times, it is necessary to strictly observe the principles given in the article. Only by understanding how to prevent the loss of existing wealth, you can move on to the next step – to increase capital.Read more: Basic knowledge of fundamental analysisAs you know, in a crisis, many assets are very cheap. Therefore, the famous phrase of Winston Churchill is the best fit for reasonable investors: "Never let a good crisis go to waste." However, the choice of reliable assets is a separate topic to which more than one article can be devoted. You can read a lot of articles or blogs about reasonable approaches in choosing reliable and promising securities, and it's better to see and hear.
In 2022, there is a lot of talk about the crisis and recession. Everyone feels that something is wrong in the economy - the costs of habitual purchases have increased and, perhaps, what they have been saving for for a long time has become significantly more expensive. In addition, many economically active people are also private investors. Moreover, a significant increase in the number of investors occurred in the last 2 years, when deposit rates were not pleasing, and investments in the stock market showed impressive results. After the growth of stock markets in the post-crisis period, 2022 has become a real test for investors. First of all, for beginners who have just joined the ranks of investors. Pros could also face certain emotional difficulties.The stock market and the quotations of individual stocks can not only rise, but also fall. This is an axiom. Sometimes the drop can amount to tens or even hundreds of percent. Often investors do not understand what to do when quotes and the amount on the account "melts before our eyes". In this article, we, as practitioners whose investment portfolio has gone through a lot since 2015, but at the same time has shown and is showing decent results, will share our experience. We will tell you what is worth and what is not worth doing during the fall of the markets. Perhaps for someone these tips and recommendations will become a soothing pill when the first panic attacks appear.Calm, only calm!It is important to maintain psychological calm in a crisis, and it is doubly important for an investor – this will help avoid impulsive actions in the market, which you may regret later. There are a few simple rules that a reasonable investor should definitely not doDo not cook in the flow of negative newsIn the modern world, for most of us, the main source of news is the Internet. One has only to click on the title on a certain topic once, the search engine will immediately helpfully fill up the feed with such news. The most "clickable" news is negative, so it is not surprising that the reader of the news feed turns out to be an unwitting prisoner of the flow of negative information. The same principle works for the media – of all the events, journalists are more likely to talk about tragic ones or thicken the colors by placing the right accents. What can we say about the Internet or the philistine media, if even professional publications "sin" like this? You can even conduct an experiment by entering the query "crisis", "recession", "market collapse" and so on in the search engine. It turns out that everything will happen literally tomorrow, and you are not ready yet.It is important to understand that the objective picture of the world is often different from the one that is formed from the news. In addition, there are always more negative messages in a crisis, periods of falling markets, and due to the peculiarities of modern media, they usually fill the news feed. Do not read the news too often - it can cause constant background stress. Therefore, one of the important psychological qualities of an investor is to be able to emotionally distance himself from bad news and remain calm. It is a calm and balanced state that will help you not lose your way and follow the chosen investment strategy.Of course, it is impossible not to be interested in what is happening at all. Moreover, in the modern information world, important information obtained from reliable sources can help you make the right decision in time. Therefore, it is important to set up your sources of information in such a way as to weed out the unnecessary and not miss a really important event in the stream of momentary sensations.Do not look every hour at the changes in quotations, remember about long-term investmentOf course, an evergreen portfolio is fine. However, stocks cannot always show growth – their peculiarity is that they never grow in a straight line, although in the long term the market is always growing. The investor should be prepared for the fact that some stocks in the portfolio are growing, some are falling. In a crisis, all stocks can fall. But the stock market, like the economy, is cyclical: a crisis always gives way to a boom, and a period of growth is followed by a recession. If we choose fundamentally reliable assets in the portfolio and are confident in our choice, the momentary market conditions cannot plunge us into panic.If we look at the dynamics of the market over the past 30 years, we will see that there have been both corrections and collapses in history. The reasons and the depth of the fall were different, but what was the same was that any market decline ends, and recovery follows.Read more: Recession in the US in 2022Don't be afraid and don't panicThe stock market and the economy as a whole are developing cyclically. Periods of boom and recession have followed each other throughout the history of mankind. Of course, a lot of things collapse in a crisis, and even stable, well-developing companies may experience difficulties. However, you should not succumb to the influence of the crowd and panic, even if everyone around is just talking about the crisis. You will say it is very difficult. Indeed, it is not easy to resist when, for example, all stocks fall by 20 or 30 percent. The only thing that can be contrasted with emotions is reason. When a person reasons logically, emotions recede into the background.The Council. It is important to maintain the ability to reasonably assess what is happening. Knowledge of the basics of investing and financial literacy and the ability to apply them in practice will help to preserve the accumulated capital.Be critical of investment adviceWhat is most interesting, both experts and people who are far from investing can give advice. A separate category in the advice section is bloggers' advice. Currently, bloggers write and shoot videos about everything that subscribers read and watch, not counting explicit advertising. Investments are popular. Please, there are plenty of gurus on the Internet who give out content about investments every day. There are two main trends in the information flow of bloggers, which are better treated critically, especially in a crisis:1. It is profitable to invest - not for an ordinary person.Bloggers often write that only large investors can make good money on insiders and gray schemes at the expense of inexperienced "hamsters". What is the interest of such an author, it is clear – articles and videos with revelations always collect more views. And a novice investor wants to avoid mistakes. Someone has already burned themselves on financial pyramids and similar scams and is starting to look for what the catch might be in investing. Especially a lot of such "sensational" materials appear in times of crisis – everyone is worried about the future, and in a crisis it is as vague as ever. Therefore, bloggers write about conspiracy theories, subscribers are disappointed in the possibilities of the stock market, merge existing assets at any price and leave the market.The Council. If you sometimes find yourself reading another revealing article about conspiracy theories in the stock market, it is better to devote this time to learning the basics of investing. This is the only reasonable way out – it is fundamental knowledge that provides a solid foundation and helps to gain confidence in their actions. It is important to choose professional training in the basics of the stock market, investments and financial literacy, because there are also a lot of training offers.Read more: How to participate in an IPO2. The second topic frequently encountered by bloggers is tips on which securities to invest in.Such materials also collect a lot of views. Consulting an independent financial analyst is expensive, and bloggers give out advice for free – and the investor shifts responsibility for the final decision from his shoulders to the blogger. This is a common psychological trap of a novice investor: to look for someone who will confidently recommend what you can invest in profitably. Of course, bloggers argue their choice one way or another, without this, the recommendations would be completely unconvincing. In addition, it cannot be said that advice on the Internet is useless – perhaps there is a rational grain in them. But in order to separate really professional advice from populist statements for the sake of views and likes, it is necessary at least to understand the basics of investing. Today it is available to everyone. Moreover, investment literacy is currently a vital skill, as relevant as the ability to drive a car, for example. It is necessary to be clearly aware that only we ourselves are responsible for our investment decisions. The blogger got the right number of views – and has already earned. It does not matter to him whether those who used the voiced investment will eventually earn.The Council. It is necessary to develop at least a basic level of expertise in investments in order to be able to adequately perceive information flows from different sources. And of course, to minimize the flow of unprofessional information is not to read or watch bloggers who give out daily content for the spite of the day for the sake of views and likes.What not to do when markets fallAbove, we tried to understand what behavior in everyday life is best avoided by an investor in order to maintain calm and the ability to rationally treat a crisis situation. However, even if the above recommendations are followed, it is worth remembering that in no case should you do on the stock market in a crisis.Read more: How to make money in crisisDo not sell shares on emotionsWhen everything is falling, it may seem like a reasonable decision to save at least something and sell the shares right now. Objectively, this may mean fixing losses. Any investment decision should be balanced, and in a crisis – doubly so. It is important to conduct a fundamental analysis of the portfolio once again. If the company retains its potential and continues to develop even in a crisis, do not sell, but, if possible, average the position.Do not violate the rules of diversificationIn a crisis, even fundamentally attractive stocks can be very cheap. Investors are tempted to buy the paper they like for a large share in the portfolio. However, no one guarantees that the selected stock will recover or even increase in price, that the company will successfully cope with the crisis. In a period of uncertainty and high risks, it is more important than ever to diversify investments as much as possible so that the possible fall of one asset does not drag down the entire portfolio.We are talking more about stocks now - they attract everyone's attention in times of crisis. Of course, a balanced portfolio should also include bonds and, possibly, other financial instruments. You can read more about the diversification of the investment portfolio here.The same principle also applies to property as a whole: it is in a crisis that the temptation is great to shift capital into shares in the hope of profitably acquiring cheaper assets.Do not bring "last money" to the marketAll crises end sooner or later. However, this may not happen tomorrow or the day after tomorrow. In no case should you invest money in stocks that you may need in the near future, even if the price seems very attractive. Recovery after the crisis may take several years, and during this time the invested funds will be "frozen".Read more: Diversification of the investment portfolio: definition & methods of implementationDo not buy assets without fundamental analysisAs much as an inexperienced beginner wants to sell everything on a wave of panic, so much more sophisticated investor in a crisis wants to buy as many shares as possible at an attractive price. This is another extreme that can trap investors during a crisis. Of course, it is worth taking advantage of the opportunity to profitably acquire good assets, however, first of all it is necessary to adhere to the principles of reasonable investment. In times of crisis, fundamental analysis will help to protect against buying unreliable assets. It is important to analyze and understand whether the selected company will be able to survive the crisis, and only after that plan to buy shares.Do not expect that the market will grow tomorrowUncertainty at the moment is characteristic of the stock market as a whole – you can never predict for sure the further movement of quotations. In a crisis, the volatility of securities is even more unpredictable: when it seems that the bottom has been reached, the fall in stocks may continue (remember the well-known investor saying "To buy at the bottom - the second bottom as a gift"). Conversely, when an investor expects a further decline in prices, a market reversal may occur.Do not use margin dealsIn times of crisis, investors are tempted to bet on rapid growth or vice versa, on the continuation of the fall in quotations, and conduct transactions with leverage for a significant amount for the portfolio:borrow shares from a broker and sell them now (a "short" transaction) in the expectation that the price of the paper will fall further, and it will be possible to purchase it at a lower price and return it to the broker;borrow money from a broker and buy shares now (long or long position long sale) in the expectation that the price of the paper will rise, and it will be possible to get a positive difference after its sale.Leverage multiplies the result of the transaction - the investor can significantly increase profits or losses compared to the result that he could get from the transaction at his own expense. Of course, borrowed funds are provided by the broker at a certain percentage. Transactions with leverage are risky, they must be treated with the utmost care. Especially in a crisis, margin transactions can be a "disservice" to the investor. If the trend is guessed incorrectly, a large volume of margin transactions can lead to a margin call, that is, to the forced sale of assets by the broker to repay the debt on margin lending. The sale will be carried out at the market price at the time of sale, which may be unprofitable for the investor. Therefore, it is absolutely not necessary to use margin transactions in a crisis in the expectation that the market will grow or fall in the near future.Read more: Leverage on the stock marketConclusionIn this article, we have considered a few simple recommendations that will allow an investor to save capital in a crisis.To maintain emotional calm, you need:Do not cook in the flow of negative news.Do not look at the price changes every hour, remember about long-term investment.Be critical of investment advice.Don't be afraid and don't panic.There are also several principles of reasonable investment, which are especially relevant in a crisis:Do not sell shares on emotions.Do not violate the rules of diversification.Don't bring all the money to the market.Do not buy assets without fundamental analysis.Do not expect that the market will grow tomorrow.You can learn to be calm in a crisis situation, you can take financial literacy training and gain a certain level of expertise in investments. However, the stock market in a crisis is fraught with some temptations that can even encourage a relatively experienced investor to violate the basic principles of reasonable investment. Therefore, in order to preserve capital in turbulent times, it is necessary to strictly observe the principles given in the article. Only by understanding how to prevent the loss of existing wealth, you can move on to the next step – to increase capital.Read more: Basic knowledge of fundamental analysisAs you know, in a crisis, many assets are very cheap. Therefore, the famous phrase of Winston Churchill is the best fit for reasonable investors: "Never let a good crisis go to waste." However, the choice of reliable assets is a separate topic to which more than one article can be devoted. You can read a lot of articles or blogs about reasonable approaches in choosing reliable and promising securities, and it's better to see and hear.