

Raw material prices are rising. When the global economy recovers, how long can the boom last?
Doug King created his hedge fund at the dawn of the commodity supercycle in 2004. It was just in time: due to insatiable demand from China, prices for everything from oil to copper rose to record highs. Investors flooded the commodity sector. At the peak of sales, King's Merchant Commodity Fund managed approximately $2 billion.
But the boom suddenly stopped after the global financial crisis of 2008 and the beginning of the shale revolution in the United States. Prices have fallen, big institutional money has come out, and many specialized hedge funds have closed.
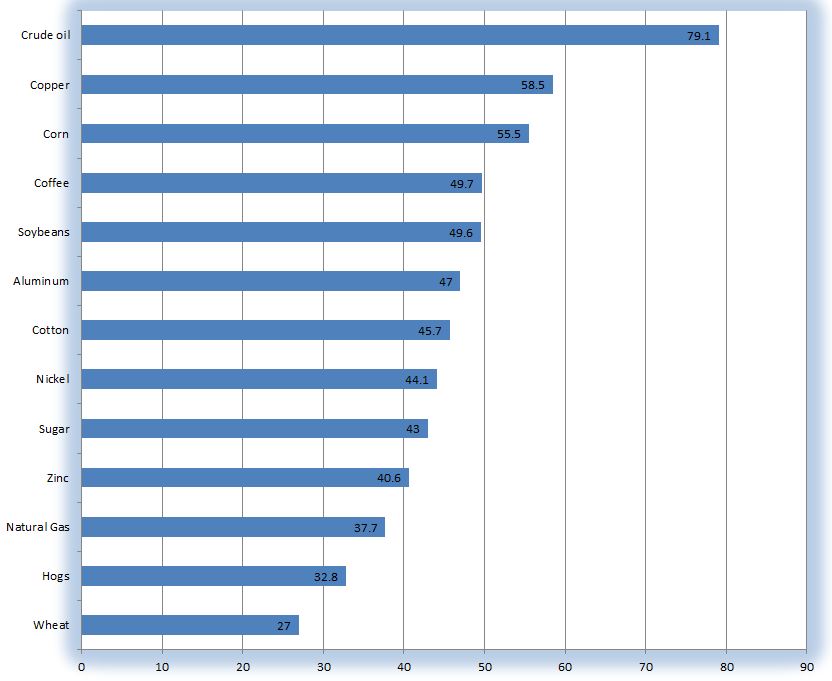
Fast forward more than ten years. For King, one of the best periods of his career has begun: a massive boom in raw materials has lifted his hedge fund by almost 50% this year, as commodities, from steel to soybeans, have reached multi-year highs. And now everyone, from pension funds to individuals who sell commodities, makes money from them. And the only question is whether this is a temporary phenomenon after the pandemic or a signal for longer-term changes in the structure of the world economy.
"We are experiencing a structural inflation shock," King said. "There is a lot of pent-up demand, and everyone wants everything now, right now."
For the first time since the pre-crisis years until 2008, the commodity boom means that central banks are concerned about inflation. The rally will also have a political impact.
With an oil price of about $70 per barrel, Saudi Arabia and Russia are once again leading the global energy market – a remarkable return after negative prices just over a year ago. The boom is also an undesirable phenomenon for politicians who are resisting the climate crisis: rising commodity prices will make the transition more expensive.
China, which depends on imported raw materials to supply millions of factories and construction sites, is so nervous that the government has tried to lower prices by threatening speculators. To some extent, this worked, as copper lost its positions achieved this year. But on average, prices remain high: iron ore is still close to a record, steel prices in the US have tripled this year, coal has risen to a 13-year high, and natural gas prices are rising.
Even after the recent pullback, the Bloomberg Commodities Spot Index, which takes into account the prices of 22 commodities, rose by 78% compared to the minimum of March 2020.
And crude oil, the most important commodity in the global economy, showed significant growth this year. This prompted traders and Wall Street banks to talk again about the possibility that prices will exceed $100 per barrel for the first time since 2014.
As prices rose, so did Wall Street's interest. The annual Robin Hood Investor Conference, which brings together hedge fund luminaries every year, from Paul Tudor Jones to Stanley F. Druckenmiller and Ray Dalio, in early June, included a discussion on commodities. For the first time in the last five years, the conference was given time to discuss commodities.
Jeff Curry, a veteran commodity researcher at Goldman Sachs Group Inc., who advocates a long-term bull market for commodities despite the recent sell-off in metals and grains, says there is room for significant investment in the market.
"Commodities are back in fashion," Curry said. Despite the hype due to sky-high prices, the sector was not able to attract large cash flows, as it was during the boom of 2004-2011.
Those investors and traders who have already invested in commodities, betting on recovery after the pandemic, were able to make a profit.
Take, for example, Cargill Inc. The world's largest agricultural commodities trader made more money in just the first nine months of the fiscal year than in any full year in its history, as net profit exceeded $4 billion.
Or Trafigura Group. It is the second-largest independent oil trader in the world, whose net profit of more than $2 billion in the six months to the end of March was almost the same as for the previous best full year.
"Our core sales units are operating at full capacity," said Jeremy Weir, chief executive of Trafigura.
However, for consumers, the commodity boom means memories of high inflation. For now, companies are mostly taking the brunt of the impact, pushing manufacturing inflation in some countries, including China, to its highest level in more than a decade. But sooner or later, consumers will also pay for it.
Companies, from Unilever Plc to Procter & Gamble Co., announced plans to raise prices in the near future.
"We are seeing levels of commodity inflation that we haven't seen in a very long time," Graham Pitketley, Unilever's chief financial officer, told investors after the release of first – quarter results. "The commodity inflation that we are seeing affects all companies."
The speed and scope of this rally, which affected dozens of raw materials from vegetable oil to coal, prompted many to talk about a new commodity supercycle, similar to the one that began almost two decades ago, when China's rapid industrialization changed the structure of the world economy. economy.
Economists usually define a supercycle as a period of abnormally high demand that oil companies, mining companies and farmers are struggling to meet, causing a rally that lasts longer than the usual business cycle. Before China, the century of modern history witnessed three different commodity supercycles, each of which was caused by a transformational socio-economic event. The industrialization of the United States gave rise to the first in the early 1900s, global rearmament gave rise to the second in the 1930s, and the recovery of Europe and Japan after World War II gave rise to the third in the 1950s and 1960s.
The appearance of the fifth supercycle would be a big event. The price rally confirms the talk of a new boom: the Bloomberg Commodity Spot Index, consisting of 23 commodities, is almost 500 points, which corresponds to the peaks of 2007-08 and 2010-11. And yet, what is more likely is that the world is still experiencing the impact of a China-led supercycle, which is now loaded with contradictory economic shifts caused by the coronavirus pandemic.
The speed and scope of this rally, which affected dozens of raw materials, from vegetable oil to coal, prompted many to talk about a new commodity supercycle, similar to the one that began almost two decades ago, when China's rapid industrialization changed the structure of the world economy.
Economists usually define a supercycle as a period of abnormally high demand that oil companies, mining companies and farmers are struggling to meet, causing a rally that lasts longer than the usual business cycle. Before China, the century of modern history witnessed three different commodity supercycles, each of which was caused by a transformational socio-economic event.
The industrialization of the United States gave rise to the first supercycle in the early 1900s, global rearmament gave rise to another in the 1930s, and the recovery of Europe and Japan after World War II gave rise to a third in the 1950s and 1960s.
The appearance of the fifth supercycle would be a big event. The price rally confirms the talk of a new boom: the Bloomberg Commodity Spot Index, consisting of 23 commodities, is almost 500 points, which corresponds to the peaks of 2007-08 and 2010-11. But it is more likely that the world is still under the influence of a super cycle led by China, which is now being spurred by the contradictory economic changes caused by the coronavirus pandemic.
Initially, Covid was bad news for commodity demand. The world was locked up, travel was reduced, factories were closed. The price of everything from oil to copper followed consumption, falling sharply between March and May last year. But after the first few months, the world began to get back on its feet, and consumption patterns changed towards commodities.
To understand what happened, it is necessary to understand the typical relationship between the demand for goods and well-being. As a rule, poor countries consume little raw materials, because most of the costs go to meet basic needs, such as food and housing.
The optimal place for commodities is countries with a per capita income of $4,000 to $18,000 – the average income range that China entered in the early 2000s. This disproportionately affects the demand for commodities, since it depends on the level of urbanization and industrialization of countries. With this range of per capita income, families have the money to buy cars, household appliances and other goods that require a lot of raw materials.
Industrially developing countries are also building railways, highways, hospitals and other public infrastructure.
The demand for goods above $20,000 per capita begins to decline as the wealthier segments of the population spend the increase in wealth on services such as better education, health care and recreation.
The coronavirus pandemic has changed this dynamic. Since many families are isolated, spending is shifting from services to goods, even in the wealthiest countries, such as the United States. In many ways, American and European consumers have been behaving in the same way as the population of developing countries for several months, spending money on buying various goods, from new bicycles to televisions.
The US economy is the best example of this trend. Overall consumer spending remains below the trends of 2018-19, but this hides a huge discrepancy between spending on goods and services. According to the Peterson Institute for International Economics, household spending on goods is currently 11% higher than the level observed before the pandemic. At the same time, spending on services such as recreation, restaurants or entertainment remains 7% lower than before the appearance of the coronavirus.
"Ultra-accommodative monetary policy, unprecedented fiscal stimulus, pent-up demand, strong household balance sheets and record savings all together paint a picture of a steady and confident growth trajectory," said Saad Rahim, chief economist at Trafigura. Fiscal stimulus has other parallels with emerging markets, as Western governments target infrastructure spending by promising to rebuild highways, railways and bridges.
Governments are also striving to build a greener future in order to abandon fossil fuels. Although this is bad news for the coal and oil markets, it means an increase in demand for raw materials such as copper, aluminum and battery metals such as cobalt and lithium, which are key to the transition to green energy.
"Commodity prices will remain high for a long time to come," said Ivan Glasenberg, the outgoing CEO of commodities giant Glencore Plc. According to him, for the first time, two superpowers of the world, the United States and China, simultaneously promoted major infrastructure projects to save their economies from the impact of the coronavirus pandemic.
The offer is trying to catch up. Some of the bottlenecks are caused by deliberate actions by producing countries, such as the OPEC+ alliance, which cut oil production last year. And another shortage is due to the complexity of the work of mines, smelters and farms at the height of the pandemic.
The decisive factor for the duration of growth is the structural restriction of supply, which means that high prices may not work as a signal to increase production and, ultimately, return the market to equilibrium.
The forces that slow down the reaction of the proposal are twofold. First, there are more and more demands from the fighters against climate change that the same production of fossil fuels, such as coal, oil and gas, be reduced. Secondly, the shareholders of the companies demand that the management pays them higher dividends, which, in turn, leaves less money for expanding mines or drilling new wells.
The impact of these forces is already evident in some areas of the commodity market, where companies stopped investing in new supplies several years ago. Take, for example, thermal coal. Mining companies have been cutting costs since at least 2015. As demand increased, coal prices jumped to a level not seen in the last 10 years. The same thing happened with iron ore, whose prices soared to a record high at the beginning of this year. The next one is likely to be oil, where companies are significantly cutting costs.
For commodity bulls like Doug King, this is a sign of doubling. "This is the beginning of a proper boom cycle, and this is not a temporary surge," he said.

 Express forex forecast for the GBP/USD pairBased on technical modeling for the pound/dollar pair, a forecast of further movement has been formed and the average price is predisposed to decline.In this technical situation, the pound can be sold from the level of 1.2614, you can also place a pending sell order at the level of 1.2679 in order to decrease to the area of 1.2525-1.2445, the stop with this strategy can be placed at the level of 1.2725.If we receive a profit of 30 points or more, we fix 50% of the position, and put the rest at breakeven. If this forecast for the GBP/USD pair coincides with your opinion, then you can safely use this strategy.Forex strategy for the USD/CAD pairThe USD/CAD pair is trading within an uptrend on a 4-hour chart. It shows that the USD/CAD exchange rate is trading above the moving average with a period of 55 on the hourly chart (level 1.3549), which generally contributes to the price increase in the short term. I recommend working on this pair from sales based on the established wave model.The signal to open a long position will be a breakdown at the end of the resistance hour at the level of 1.3629 in order to increase to the resistance at the level of 1.3678 and in case of its breakdown at the end of the hour to 1.3736. The stop loss with this strategy can be placed at the level of 1.3540.The signal to open a short position will be a breakdown at the end of the support hour at 1.3549 with the aim of reducing to support at 1.3488 in case of its breakdown at the end of the 1.3429 hour. The stop loss with this strategy can be placed at the level of 1.3653.Given that the moving average and the location of the boundaries of technical figures are moving over time, it is necessary to adjust their position on the hourly chart. I also recommend opening positions at the end of the hour to avoid false breakouts.
  Express forex forecast for the GBP/USD pairBased on technical modeling for the pound/dollar pair, a forecast of further movement has been formed and the average is urgently predisposed to an increase.In this technical situation, the pound can be bought from the level of 1.2591, you can also place a pending purchase order at the level of 1.2551 in order to increase to the area of 1.2733-1.2984, the stop with this strategy can be placed at the level of 1.2530.If we receive a profit of 30 points or more, we fix 50% of the position, and put the rest at breakeven. If this forecast for the GBP/USD pair coincides with your opinion, then you can safely use this strategy.Forex strategy for the USD/CAD pairThe USD/CAD pair is trading within an uptrend on a 4-hour chart. It shows that the USD/CAD exchange rate is trading above the moving average with a period of 55 on the hourly chart (level 1.3547), which generally contributes to the price increase in the short term. I recommend working on this pair from sales based on the established wave model.The signal to open a long position will be a breakdown at the end of the resistance hour at 1.3627 in order to increase to the resistance at 1.3678 and in case of its breakdown at the end of the hour to 1.3719. Stop loss with this strategy can be placed at 1.3560.The signal to open a short position will be a breakdown at the end of the support hour at the level of 1.3488 with the aim of reducing to support at the level of 1.3429 in case of its breakdown at the end of the hour 1.3381. The stop loss with this strategy can be placed at the level of 1.3615.Given that the moving average and the location of the boundaries of technical figures are moving over time, it is necessary to adjust their position on the hourly chart. I also recommend opening positions at the end of the hour to avoid false breakouts.
  Forex forecast for USD/CADThe USD/CAD pair is trading within an uptrend on a 4-hour chart. It shows that the USD/CAD exchange rate is trading above the moving average with a period of 55 on the hourly chart (level 1.3509), which generally contributes to the price increase in the short term. I recommend working on this pair from sales based on the established wave model.The signal to open a long position will be a breakdown at the end of the resistance hour at 1.3575 in order to increase to the resistance at 1.3627 and in case of its breakdown at the end of the hour to 1.3678. Stop loss with this strategy can be placed at 1.3480.The signal to open a short position will be a breakdown at the end of the support hour at 1.3488 with the aim of reducing to support at 1.3429 in case of its breakdown at the end of the 1.3381 hour. The stop loss with this strategy can be placed at the level of 1.3615.Given that the moving average and the location of the boundaries of technical figures are moving over time, it is necessary to adjust their position on the hourly chart. I also recommend opening positions at the end of the hour to avoid false breakouts.Forex forecast for GBP/USDBased on technical modeling for the pound/dollar pair, a forecast of further movement has been formed and the average price is predisposed to decline.In this technical situation, the pound can be sold from the level of 1.2725, you can also place a pending sell order at the level of 1.2767 in order to decrease to the area of 1.2609-1.2508, the stop with this strategy can be placed at the level of 1.2830.If we receive a profit of 30 points or more, we fix 50% of the position, and put the rest at breakeven. If this forecast for the GBP/USD pair coincides with your opinion, then you can safely use this strategy.
  Forex forecast for USD/CADThe USD/CAD pair is trading within an uptrend on a 4-hour chart. It shows that the USD/CAD exchange rate is trading above the moving average with a period of 55 on the hourly chart (level 1.3509), which generally contributes to the price increase in the short term. I recommend working on this pair from sales based on the established wave model.The signal to open a long position will be a breakdown at the end of the resistance hour at 1.3568 in order to increase to the resistance at 1.3618 and in case of its breakdown at the end of the hour to 1.3678. Stop loss with this strategy can be placed at 1.3480.The signal to open a short position will be a breakdown at the end of the support hour at 1.3488 with the aim of reducing to support at 1.3429 in case of its breakdown at the end of the 1.3381 hour. The stop loss with this strategy can be placed at the level of 1.3595.Given that the moving average and the location of the boundaries of technical figures are moving over time, it is necessary to adjust their position on the hourly chart. I also recommend opening positions at the end of the hour to avoid false breakouts.Forex forecast for GBP/USDBased on technical modeling for the pound/dollar pair, a forecast of further movement has been formed and the average price is predisposed to decline.In this technical situation, the pound can be sold from the level of 1.2742, you can also place a pending sell order at the level of 1.2767 in order to decrease to the area of 1.2609-1.2508, the stop with this strategy can be placed at the level of 1.2830.In the case of a profit of 30 points or more, we fix 50% of the position, and put the rest at no loss. If this forecast for the GBP/USD pair coincides with your opinion, then you can safely use this strategy.
  Forex forecast for USD/CADThe USD/CAD pair is trading within an uptrend on a 4-hour chart. It shows that the USD/CAD exchange rate is trading above the moving average with a period of 55 on the hourly chart (level 1.3501), which generally contributes to the price increase in the short term. I recommend working on this pair from sales based on the established wave model.The signal to open a long position will be a breakdown at the end of the resistance hour at 1.3568 in order to increase to the resistance at 1.3618 and in case of its breakdown at the end of the hour to 1.3678. Stop loss with this strategy can be placed at 1.3480.The signal to open a short position will be a breakdown at the end of the support hour at 1.3488 with the aim of reducing to support at 1.3429 in case of its breakdown at the end of the 1.3381 hour. The stop loss with this strategy can be placed at the level of 1.3595.Given that the moving average and the location of the boundaries of technical figures are moving over time, it is necessary to adjust their position on the hourly chart. I also recommend opening positions at the end of the hour to avoid false breakouts.Forex forecast for British pound/US dollarBased on technical modeling for the pound/dollar pair, a forecast of further movement has been formed and the average is urgently predisposed to an increase.In this technical situation, the pound can be bought from the level of 1.2765, you can also place a pending purchase order at the level of 1.2730 in order to increase to the area of 1.2878-1.2987, the stop with this strategy can be placed at the level of 1.2650.In the case of a profit of 30 points or more, we fix 50% of the position, and put the rest at no loss. If this forecast for the GBP/USD pair coincides with your opinion, then you can safely use this strategy.
  USDCAD signalsUSDCAD is trading in a downtrend on the 4-hour chart. It shows that the USD/CAD rate is trading below the moving average with a period of 55 on the hourly chart (the level of 1.3462), which generally contributes to the decline in the price in the short term. I recommend to sell on this pair on the basis of the existing wave pattern.The signal for long position opening will be a break-down and fixing above the resistance at 1.3500 with the aim to go up to the resistance level of 1.3552 and in case of its break-down at the end of the hour to 1.3606. Stop loss in this strategy may be placed at the level of 1.3440.The signal for the opening of a short position is a break-down and fixation at the level of 1.3349 with the aim of going down to the support at 1.3295, in case of its breakdown an hour later, to 1.3243. Stop-loss in this strategy can be placed at the level of 1.3475.EURUSD signalsEURUSD is trading within the ascending price channel on the hourly chart. I recommend opening long positions in case the pair breaks through and rises above the resistance at 1.0810, aiming to the resistance at 1.0837-1.0869. Stop loss below 1.0760.I recommend to open short positions after breakdown and fixation below the support at the level of 1.0764 with the aim to go down to the support at the level of 1.0737-1.0710. Stop-loss is above 1.0820.GBPUSD signalsOn the basis of technical modeling on pair pound/dollar the forecast of the further movement was formed and the average urgency is predisposed to rise.In the given technical situation pound can be bought from the level of 1.2243 and also it is possible to expose the pending buy order at the level of 1.2170 with the purpose of increase in the area of resistance at the level of 1.2353-1.2446, the stop at this strategy can be placed at the level of 1.2070.
  USDCAD signalsUSDCAD is trading in a downtrend on the 4-hour chart. It shows that the USD/CAD rate is trading below the moving average with a period of 55 on the hourly chart (the level of 1.3479), which generally contributes to the decline in the price in the short term. I recommend to sell on this pair on the basis of the existing wave pattern.The signal for long position opening will be a breakdown and fixation at the level of 1.3500 with the aim to go up to the resistance at 1.3552 and in case of its breakdown and fixation at the level of 1.3606. Stop loss in this strategy may be placed at the level of 1.3440.The signal for the opening of a short position will be a breakdown and fixation at the level of 1.3349 with the aim of reducing to the support at the level of 1.3295 in case of its breakdown and fixation at 1.3243. Stop-loss may be set at the level of 1.3475.EURUSD signalsThe EURUSD pair is trading within the ascending price channel on the hourly chart. I recommend opening long positions in case of breakdown of the resistance at 1.0870 with the aim of going up to the resistance at 1.0900-1.0931. Stop-loss below 1.0800.I recommend to open short positions after breakdown of support at 1.0807 with the aim to go down to support at 1.0781-1.0751. Stop loss is above 1.0885.GBPUSD signalsOn the basis of technical modeling on pair pound/dollar the forecast of the further movement was formed and the average urgent predisposition to increase.In the given technical situation pound can be bought from the level of 1.2226 and also it is possible to expose the pending buy order at the level of 1.2122 with the purpose of increase in the area of resistance at the level of 1.2374-1.2494, the stop at this strategy can be placed at the level of 1.2070.
  USDCAD SignalsUSDCAD is trading in a downtrend on the 4-hour chart. It can be seen that the rate USD/CAD trades below the moving average with a period of 55 on the hour chart (level 1.3540), which generally contributes to the decline in the price in the short term. I recommend to sell on this pair on the basis of the existing wave pattern.The signal for long position opening will be a breakdown by the results of the hour and fixing above the resistance at 1.3446 with the aim to go up to the resistance level of 1.3500 and in case of its breakdown and fixing by the results of the hour - further to 1.3552. Stop-loss may be placed at the level of 1.3350.The signal for the opening of a short position is a breakdown and fixation below the support at 1.3362 with the aim of reducing to the support at 1.3317, in case of its breakdown and fixation at 1.3259. Stop loss can be set at 1.3455.EURUSD SignalsThe EURUSD pair is trading within the ascending price channel on the hourly chart. I recommend opening long positions in case of breakdown and fixation at the level of 1.0759 with the aim of going up to the resistance at 1.0785-1.0809. Stop loss below 1.0710.I recommend opening short positions after breakdown of support at 1.0720 with the aim to go down to support at 1.0696-1.0667. Stop-loss is above 1.0770.GBPUSD SignalsOn the basis of technical modeling on pair pound/dollar the forecast of the further movement was formed and the average urgent predisposition to increase.In the given technical situation pound can be bought from the level of 1.2147 and also it is possible to expose the pending buy order at the level of 1.2060 with the purpose of increase in the area of resistance at the level of 1.2344-1.2446, the stop at the given strategy can be placed at the level of 1.2040.